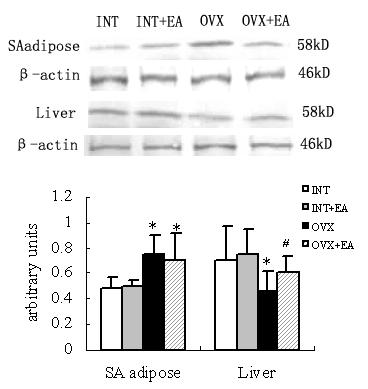
Figure 4.

Effects of the electroacupuncture on the aromatase expressions by Western blot analysis. The upper picture shows the Western blot analysis of the aromatase P450. The SA adipose and liver tissue samples (50 mg/lane) were electrophoresed and blotted onto the membrane, and aromatase was then detected using the polyclonal antibody as described in materials and methods. Densitometric analysis of the protein concentration using aromatase/β-actin expressed as the mean with SEM bar (nINT = 12, nINT+EA = 12, nOVX = 12 and nOVX+EA = 10) in each column indicated in the lower panel. * p < 0.05 vs INT, INT+EA and OVX, # p < 0.05 vs OVX
