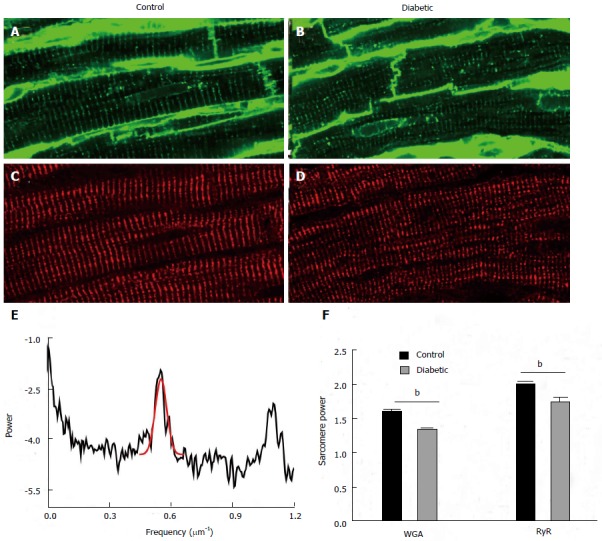
Figure 3.

Structural changes in proteins associated with excitation-contraction coupling. Transverse tubules were visualised by labelling with wheat germ agglutinin in (A) control and (B) diabetic tissue. The same tissue sections were dual labelled with antibodies against ryanodine receptors (RyR) in (C) control and (D) diabetic tissue. The periodicity or regularity of labelling was assessed using a fast Fourier transform. An example of this analysis is shown in (E) which is the plot of the FFT in control myocyte labelled with RyR. The peak associated with sarcomeric periodicity (approximately 0.55 μm-1) is fitted with a Gaussian in red. The height of this peak is used as a metric to assess the regularity of sarcomere labelling termed “sarcomere” power. (F) This shows the mean sarcomere power for both wheat germ agglutinin and ryanodine receptor labelling from 18 cells from 3 control animals and 18 cells from 3 diabetic animals. Both wheat germ agglutinin and ryanodine receptor sarcomere power were modestly but highly significantly reduced in cells from diabetic hearts (Bonferroni corrected t test, bP < 0.01, diabetic vs control.).
