
Figure 2.
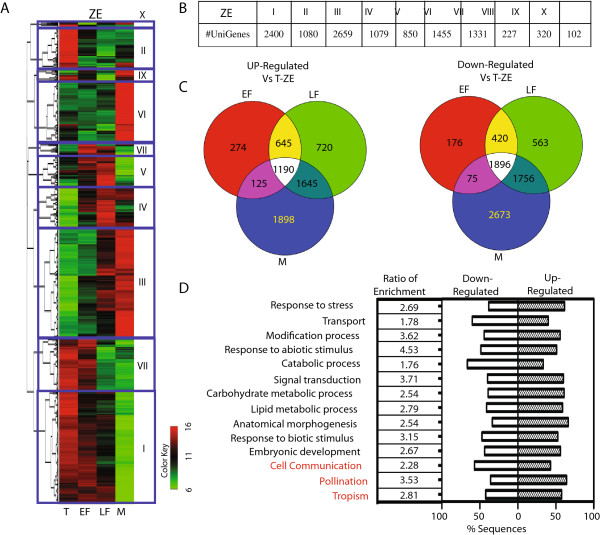
Differential gene expression during zygotic embryo development (ZE). (A) Heatmap of all differentially expressed genes during zygotic embryo maturation: Torpedo (T), Early-Full (EF), Late-Full (LF), Mature (M). All differentially expressed genes were grouped into 10 clusters using the K-means algorithm. (B) Number of differentially expressed genes in each ZE cluster. (C) Venn-diagram of differentially expressed genes in ZE. (D) GO enrichment analysis of all differentially expressed genes in ZE. Go categories in red indicate the genes enriched only in ZE group.