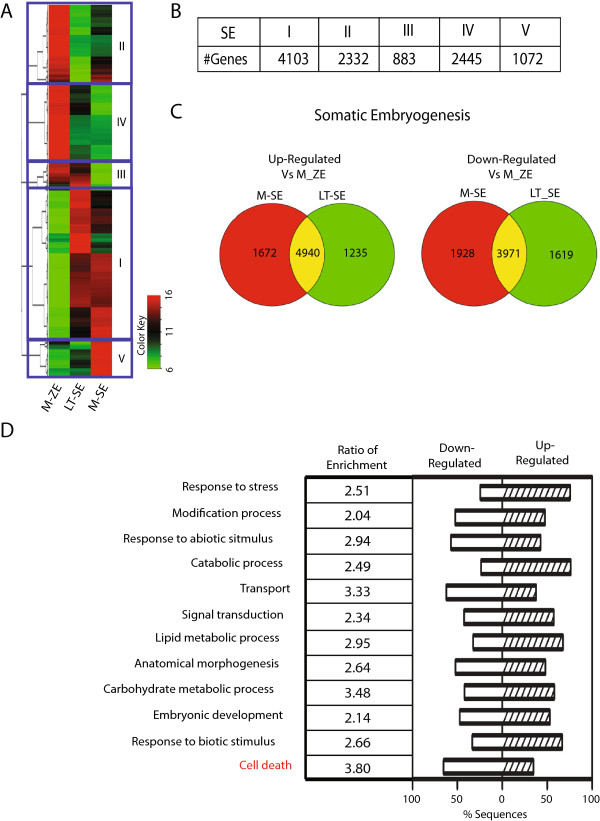
Figure 4.

Cluster analysis of differentially expressed genes during somatic embryo (SE) maturation using mature zygotic embryo developmental stage as a reference. (A) Heatmap of all SE differentially expressed genes, stages Late Torpedo (LT-SE) and Mature (M-SE) compared to Mature Zygotic Embryo stage (M-ZE). All differentially expressed genes were grouped into 5 clusters using K-means algorithm. (B) Number of differentially expressed genes in each MSE cluster. (C) Venn-diagram of differentially expressed genes in MSE. (D) GO enrichment analysis of all differentially expressed genes in SE. GO categories labeled in red indicate the genes enriched only in SE group.
