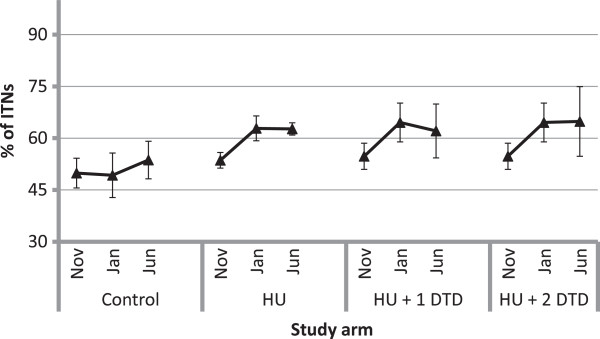
Figure 4.

Proportion of existing insecticide-treated nets in the households used the previous night. Within each study arm, the markers represent the estimates from the first (November 2011), second (January 2012) and third (June 2012) evaluations, respectively. Note that the results for the first and second evaluations are shared between the HU + 1 DTD and HU + 2 DTD arms and differ only for the third evaluation.
