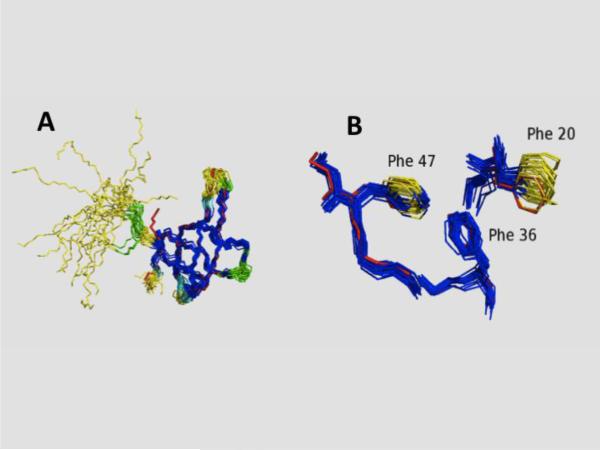
Fig. 1.
Comparison of DOAP and variance distance matrix results for identifying well-defined atom sets. (A) NMR structure ensemble superimposition showing residues defined as “well defined” by the PDBStat DAOP analysis [20] and those identified as “well defined” by the FindCore [20,58,59] variance matrix analysis for protein SgR42 (PDB_id 2jz2). Residues identified as “well defined” by both methods are shown in dark blue, those identified as “well defined” by variance matrix but not by DAOP in light blue, and those identified as “well defined’ by DAOP but not by variance matrix in green. Residues that identified as “ill defined” by both methods are shown in yellow. The backbone atoms of the corresponding X-ray crystal structure (PDB id 3c4s) are shown in red. (B) Expansion showing atom-specific “well defined” (dark blue) and “ill defined” (yellow) designations for the sidechains of residues Phe20, Phe36, and Phe47 in protein SgR42. This image demonstrates the value of atom-specific designations of well-defined regions of a protein NMR structure. Adopted from ref [20].

