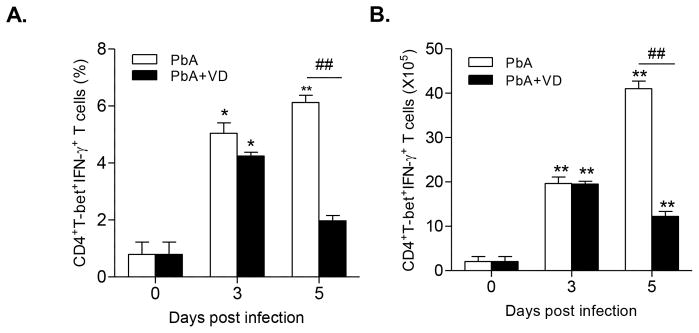
FIGURE 5.

VD reduces the expansion of CD4+T-bet+IFN-γ+ T cells. Both proportion (A) and the absolute number (B) of the CD4+T-bet+IFN-γ+ T cells in the spleens were quantified. Each experiment was repeated three times. For each experiment, five mice were used per group. Values represent the mean ± SEM (n=5 mice per group). * and ** indicate significant differences between the values in PbA-infected mice and the baseline levels on day 0 at P<0.05 and P<0.01, respectively. # and ## indicate significant difference between the PbA and PbA+VD groups at P<0.05 and P<0.01.
