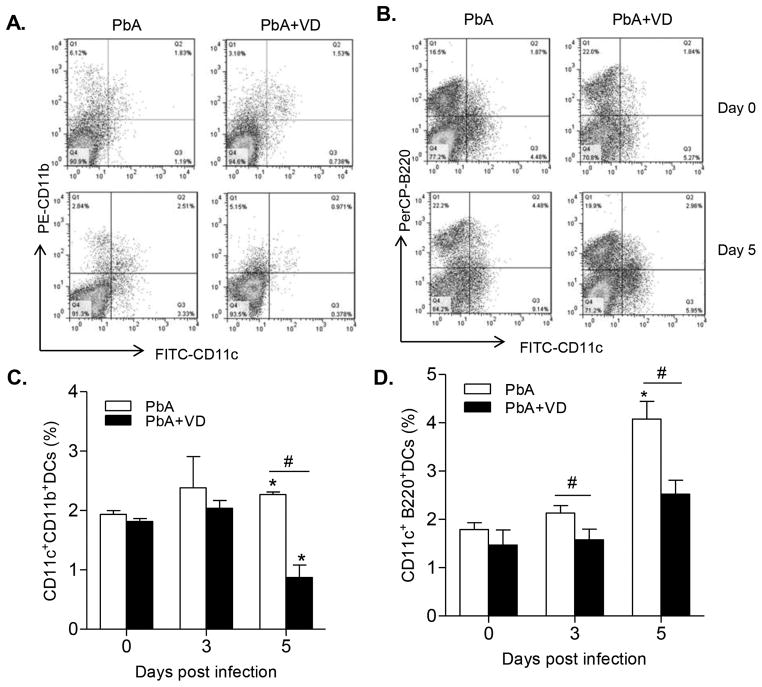
FIGURE 7.
VD treatment inhibited the expansion of DC subsets. The frequency of CD11c+CD11b+ DCs (mDCs), and CD11c+B220+ DCs (pDCs) were measured by flow cytometry. (A,B) Representative plots showing the proportions of the two DC populations. (C,D) Bar graphs show the frequencies of the two DC populations within the spleens. Data are presented as the mean ± SEM (n=5 mice per group). Results are representatives of three independent experiments. * indicates significant difference between the values in PbA-infected mice and the baseline levels on day 0 (P<0.05). # indicates significant difference between the PbA and PbA+VD groups (P<0.05).

