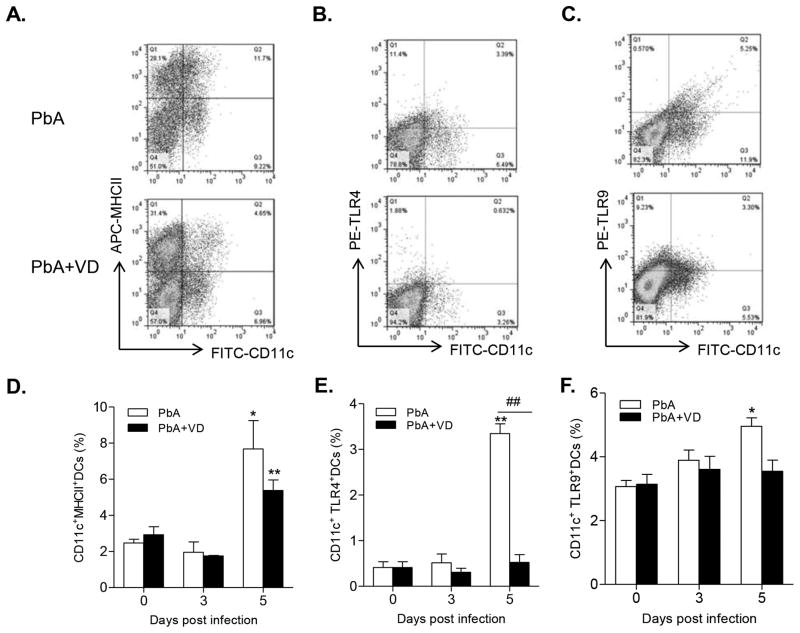
FIGURE 8.
VD treatment inhibited DC differentiation, maturation and activation. The frequency of CD11c+ DCs expressing MHC II (A,D), TLR-4 (B,E) and intracellular TLR-9 (C,F) within the spleen were determined by flow cytometry. (A–C) Representative dot plots show the proportion of each cell subsets within the spleen at day 5 p.i. (D–E) Graphs show the frequencies of the respective DC populations. Data are presented as the mean ± SEM (n=5 per group). Results are representatives of three independent experiments. * and ** indicate significant differences between the values in PbA-infected mice and the baseline levels on day 0 at P<0.05 and P<0.01, respectively. ## indicates significant difference between the PbA and PbA+VD groups (P<0.01).

