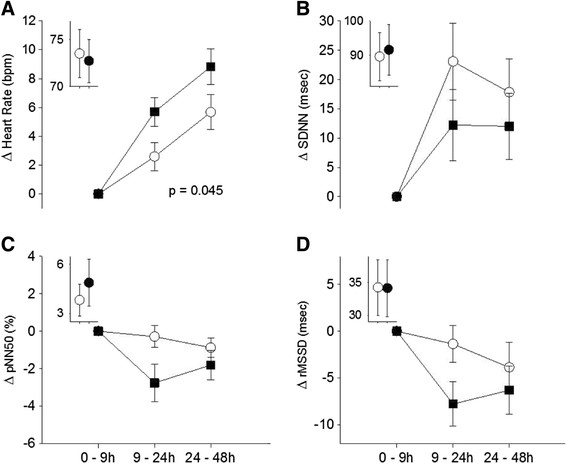
Figure 2.

ECG changes during longer monitoring periods. Mean ± SE change from first monitoring period (0–9 hours, which included the exposure and first few hours afterward) to subsequent 2 monitoring periods, in heart rate (A), SDNN (B), pNN50 (C), and rMSSD (D) in subjects exposed to elemental carbon UFP (solid boxes) and filtered air (open circles). The insets show actual mean values for the 0–9 hours monitoring period, which was used as the baseline. P-value is for mixed models main effect of exposure.
