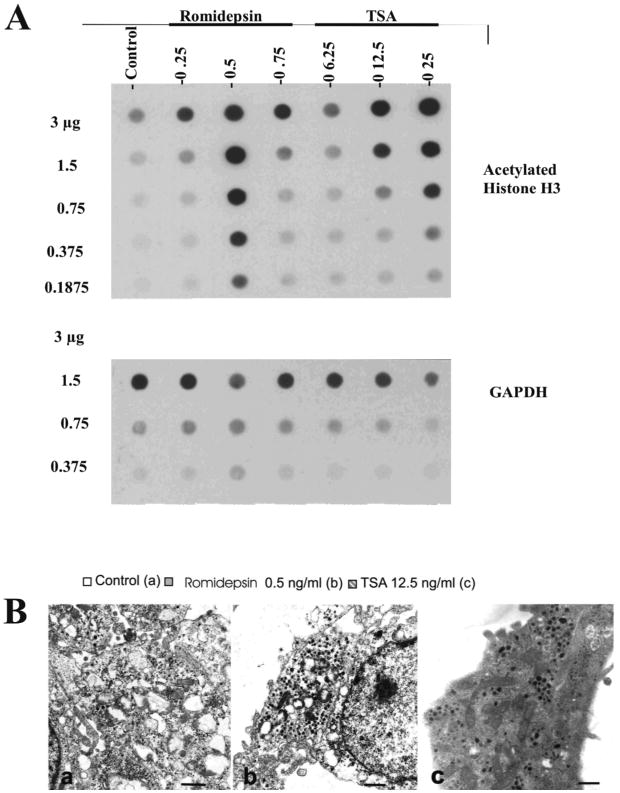
Figure 3.

(A) Expression of acetylated histone H3 for at various concentrations of romidepsin and trichostatin A as examined by dot blot analysis. GAPDH was a loading [?] control. (B) EM photomicrographs of MPC cells showing the presence of granules in treated cells: (a) untreated cells, (b) romidepsin 0.5 ng/mL, (c) trichostatin A 12.5 ng/mL. Bar = 1 micron.
