Figure 3.

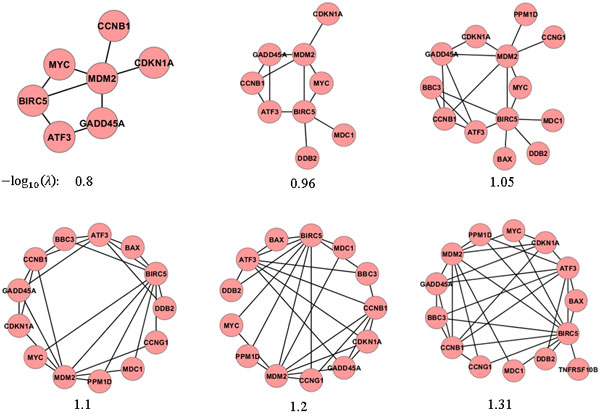
Change in estimated networks. Networks estimated when the graphical lasso algorithm was applied to GSE1977 with 6 different values.

Change in estimated networks. Networks estimated when the graphical lasso algorithm was applied to GSE1977 with 6 different values.