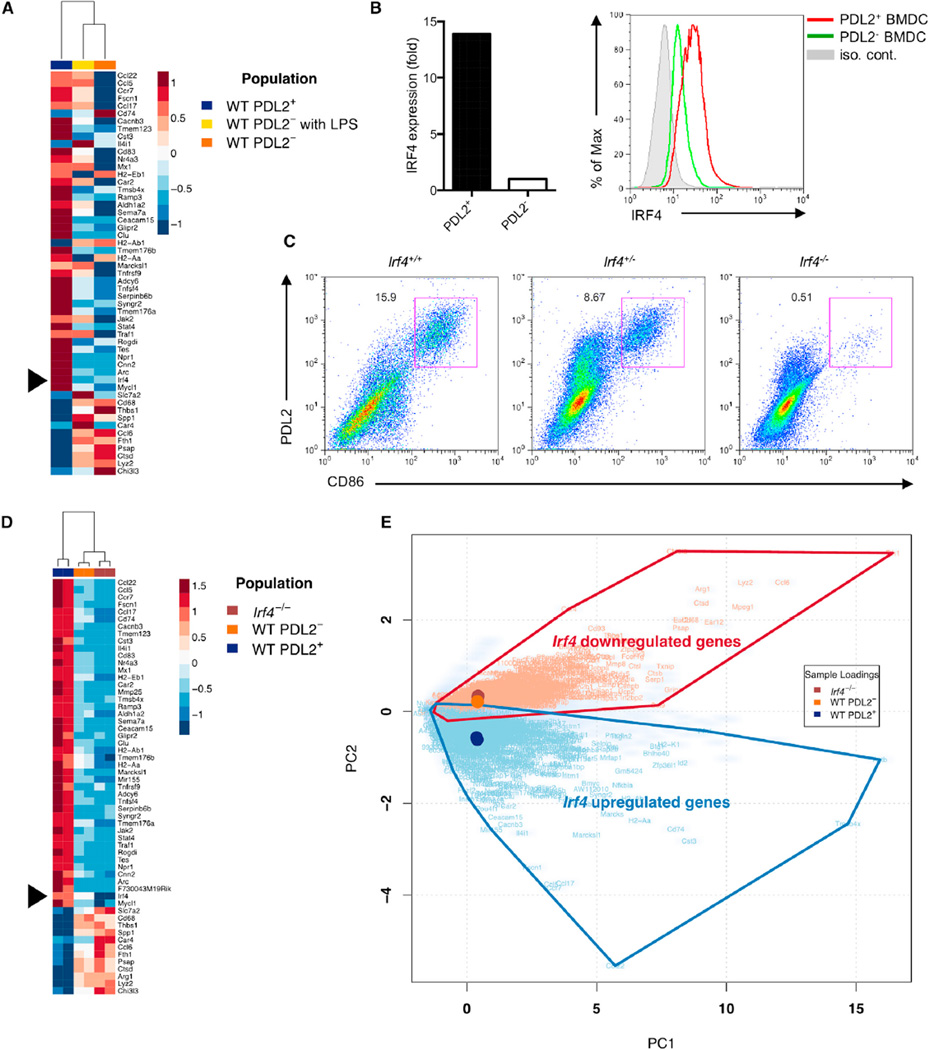
Figure 4. IRF4 Expression Is Critical for the Development of Bone-Marrow-Derived PDL2+ DCs.
(A) Microarray analysis of log2 transformed expression amounts from three BMDC populations (PDL2+, PDL2−, and LPS stimulated PDL2−). Irf4 is indicated. Genes displayed correspond to those identified as significant by RNA-Seq analysis.
(B) IRF4 mRNA and protein expression in PDL2+ BMDCs was examined by real-time RT-PCR and flow cytometry, respectively. Data are representative of at least three independent experiments.
(C) Percentages of PDL2+ BMDCs in WT, Irf4+/− and Irf4−/− bone-marrow cultures. Data are representative of three independent experiments.
(D and E) RNA-seq analysis of gene expression in three BMDC populations (WT PDL2+, WT PDL2−, and Irf4−/−). Heatmap of square root transformed RPKM values for genes with PC2 scores greater than a designated absolute threshold value of ± 2.38 (D). Biplot derived from PCA analysis of gene summarized RPKM values (cloudy blue) plotted according to two PCs that account for > 80% of total sample variance (E). PC1 describes overall expression and PC2 describes differential expression between populations. Sample loading vectors and the symbols of overlapping, differentially expressed genes (Benjamini-Hochberg adjusted p value < 10−50 by negative binomial testing) are displayed.
See also Figure S4.

