
Figure 6.
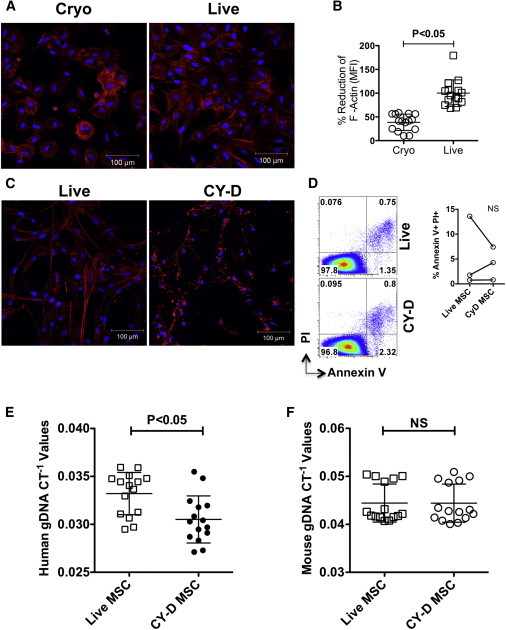
Cryo MSCs Show Defective F-Actin Polymerization Compared with Live MSCs
(A) MSCs thawed from cryopreservation (cryo MSCs) or MSCs trypsinized out of the flasks from the incubator (live MSCs) were seeded onto fibronectin-coated glass coverslips. Two hours after attachment, cells were fixed with formalin and stained for F-actin (red, phalloidin conjugated with Alexa 555) and nuclei (blue, DAPI). Images were taken using a Zeiss microscope at 20× magnification.
(B) Percentage reduction of F-actin MFI in cryo MSCs compared with live MSCs.
(C) Nontreated MSCs and MSCs treated with Cytochalasin D (2 μM) for 2 hr were seeded onto fibronectin-coated glass coverslips and then stained for F-actin (red) and DAPI (blue).
(D) Cytochalasin D-treated MSCs and nontreated MSCs were trypsinized, subjected to Annexin V/PI staining, and analyzed by flow cytometry.
(E and F) MSCs (1 × 10⁶) with or without Cytochalasin D treatment were injected intravenously into C57BL/B6 mice via the tail vein. At 24 hr postinfusion, the animals were sacrificed and the lungs were excised to extract total gDNA for real-time PCR amplification of (E) human gDNA and (F) mouse gDNA. In vitro F-actin quantification is shown as the cumulative mean ± SD based on the averaged signal of at least five unique fields from two independent experiments with two separate MSCs donors. In vivo individual CT−1 values and the cumulative mean ± SD from three independent experiments (n = 4–5 animals per group) performed with two unique MSC donors are shown. A p value < 0.05 was considered statistically significant based on two-tailed t tests.
See also Figure S4.