
Figure 3.
HCV Infection of hESC-Heps and Huh7
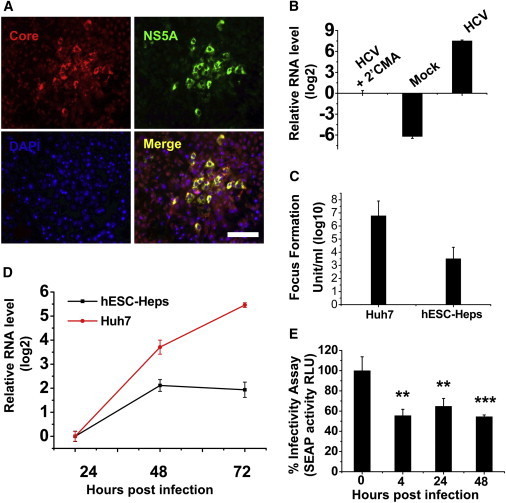
(A) Day 19 hESC-Heps were exposed to JFH-1-based HCVcc. Three days postinfection, cells were double stained for HCV core (red) and NS5A (green). Nuclei were counterstained with DAPI (blue). Scale bar, 100 μm.
(B) hESC-Heps were either mock infected or infected with HCV in the presence or absence of 2′CMA. HCV RNA levels, relative to HCV with 2′CMA group, were detected by qPCR.
(C) At 72 hr postinfection, the infectious virus yield in the medium of infected Huh7 or hESC-Heps was determined on naive Huh7 cells by focus-forming assay, and the values presented as focus-forming units (FFU) per ml (log10).
(D) Comparison of HCV RNA levels in infected cells by qPCR. Fold change relative to that of 24 hr postinfection in hESC-Heps (black line) or Huh7 (red line) cells was calculated.
(E) Antiviral activity of conditioned medium from hESC-Heps infected by HCV. Huh7-J20 reporter cells preinfected with HCV for 3 hr were incubated for 48 hr with the supernatants from hESC-Heps collected at 0, 4, 24, or 48 hr postinfection with HCV. The effect of hESC-Hep supernatants on virus infection in Huh7-J20 cells was determined by measuring SEAP activity in the medium, which correlates directly with virus replication. ∗∗p < 0.01, ∗∗∗p < 0.001 compared with the group of 0 hr postinfection.
Error bars represent the SD of the mean. n = 3, biological replicates. See also Figure S2 and Tables S1 and S2.