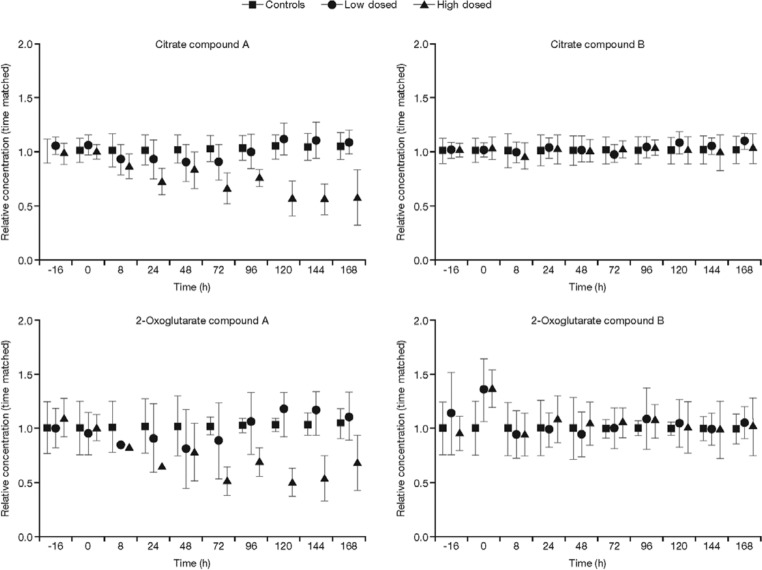
Figure 2.
Levels of tricarboxylic acid cycle intermediates by nuclear magnetic resonance analysis, following dosing and normalized to time-matched control animals. Levels of urinary citrate and 2-oxoglutarate are shown for animals dosed with high and low doses of compound A (left) and compound B (right).

