
Figure 3.
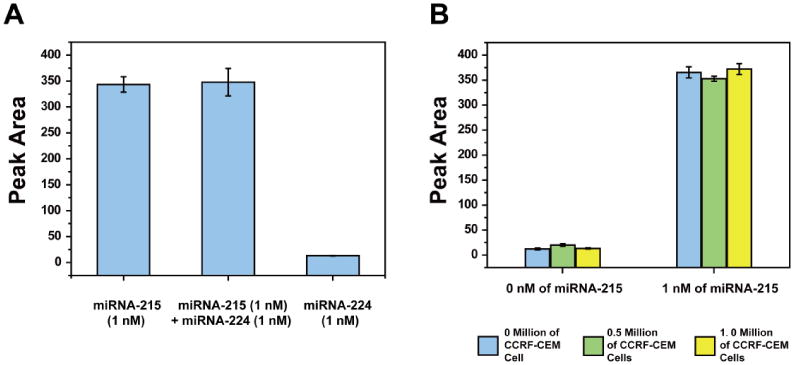
A) The optical intensities (peak areas) of the LFNAB test zones analyzed in the presence of 1-nM miRNA-215, mixture of 1-nM miRNA-215 and 1-nM miRNA-224, and 1-nM miRNA-224; B) the optical intensities of the LFNAB test zones in the presence (1 nM) and absence (0 nM) of target miRNA-215 with different amounts of CCRF-CEM (CCL-119) cells in cell lysate. Blue column (left): 0 million of CCRF-CEM cells; Green column (middle): 0.5 million of CCRF-CEM cells; Yellow column (right): 1.0 million of CCRF-CEM cells. Experimental conditions were same as in Figure 2.