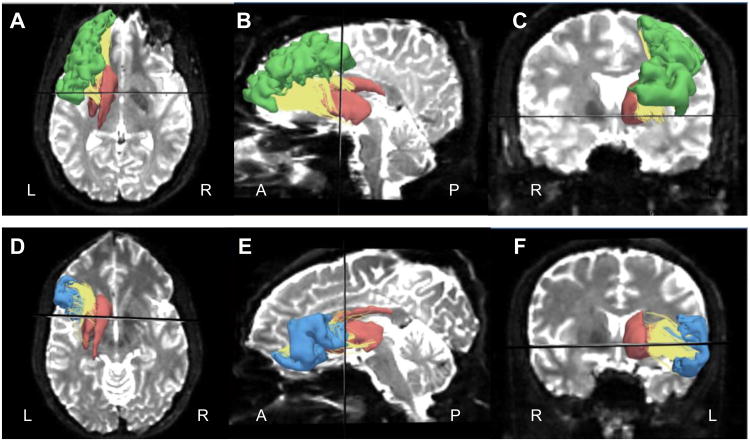
Figure 1.
Tracts (yellow) and ROIs including rMFG (green), IFG (blue) and striatum (red) overlaid on a diffusion image. A-C show rMFG-striatum tracts and related ROIs in axial, sagittal and coronal slices respectively. D-F show IFG-striatum tracts and related ROIs in axial, sagittal and coronal slices respectively. The black line represents a plane, which includes the anterior commissure. L: left, R: right, A: anterior, P: posterior.

