
Figure 8.
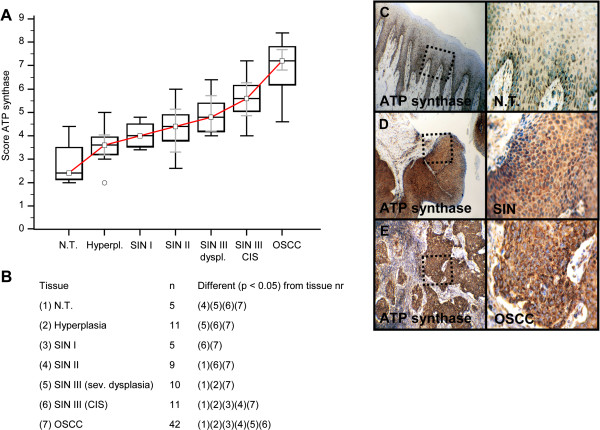
Immunohistochemical analysis and staining of ATP synthase in normal oral mucosal tissue, oral precursor lesions - hyperplasia, SIN I, SIN II, SIN III, and invasive OSCC. In comparison to normal tissue/hyperplasia a significantly (p < 0.05, Kruskal-Wallis Test; A and B) increased expression of ATP synthase is observed in OSCC. ATP synthase expression is significantly increased in OSCC compared with SIN I-III (p < 0.0001, Mann–Whitney U Test). Analysis refers to averaged scores. Red line indicates ATP synthase expression results during carcinogenesis. Grey lines show 95% confidence intervals. Analysis of significant statistically different single values is indicated in the table below (B). ATP synthase is subdivided in severe dysplasia (sev. dysplasia) and carcinoma in situ (CIS). SIN, squamous intraepithelial neoplasia; N.T., normal tissue. Immunohistochemical staining shows representative images of ATP synthase expression in N.T. (C), SIN (D), and OSCC (E). Brown chromogen color (3,3′-Diaminobenzidine) indicates positive staining, the blue color shows the nuclear counterstaining by hematoxylin. The square box demonstrates the area of interest (original magnification: x100-fold, left panel) which is also shown in larger magnification (x200-fold, right panel).