
Figure 3.
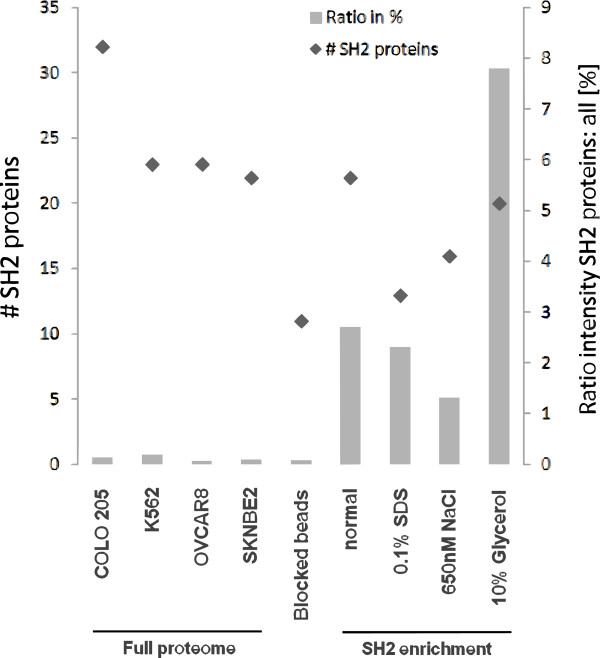
SH2 protein enrichment. The MS-intensity ratio of SH2 proteins in relation to all identified proteins (right y axis) and the number of identified SH2 proteins (left y axis). Displayed is full proteome data from Colo205, K562, Ovcar8 and SKNBE2 cells (without probe 1 enrichment), pull-down data applying blocked beads and pull-down data applying probe 1 to mixed cell lysates of Colo205, K562, Ovcar8 and SKNBE2 cells.