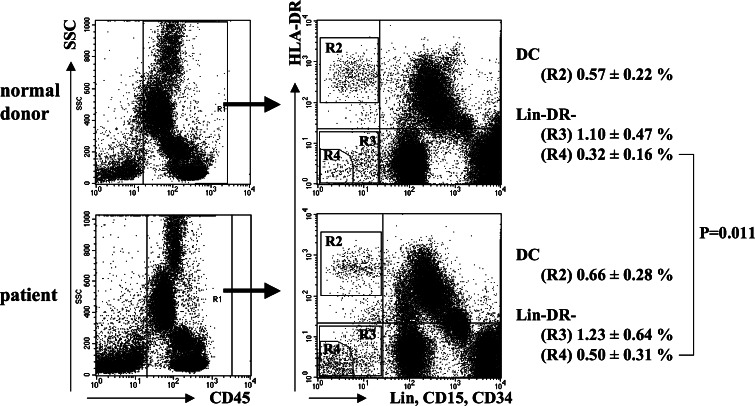
Fig. 1.
Schema for enumerating dendritic cells and immature myeloid cells. CD45+ cells were gated and analyzed for lineage marker and HLA-DR expression. R2 shows DC population. R3 shows CD45+ lineage− HLA-DR− cell population. R4 shows the cell population with the least fluorescence for lineage markers and HLA-DR

