
Figure 6.
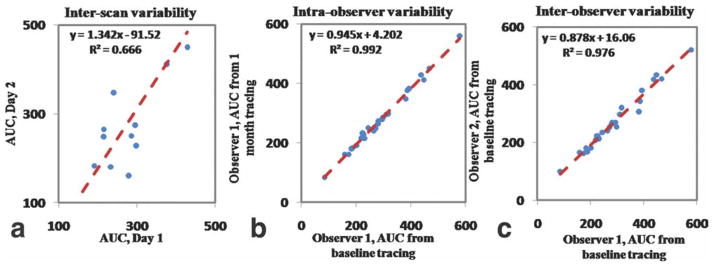
Correlations between: (a) AUC 1 minute evaluated on DCE-MRI scan of day 1 versus AUC 2 minutes evaluated on DCE-MRI scan of day 2 for the evaluation of interscan variability; (b) AUC 1 minute, baseline tracings of observer 1 versus 1 month tracings of the same observer for the evaluation of intraobserver variability; (c) AUC 1 minute, baseline tracings of observer 1 versus baseline tracings of observer for the evaluation of interobserver variability. Red dashed line indicates regression line. Both axes represent AUC values expressed in absolute units.