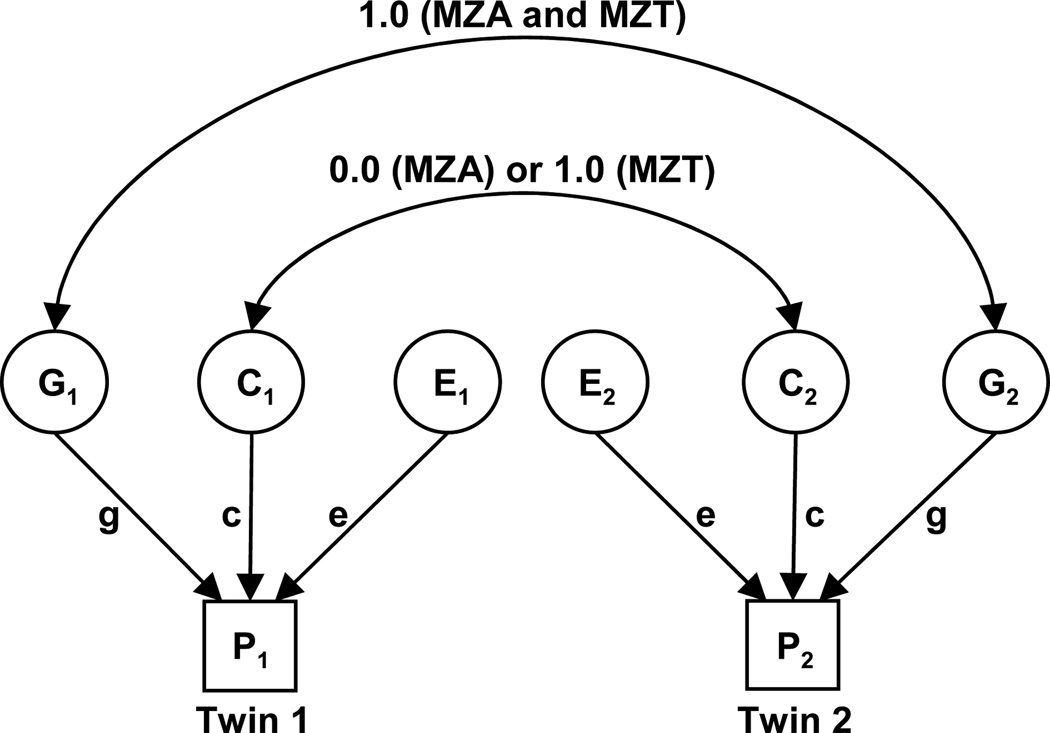
Fig. (1).
Path diagram of the univariate MZA/MZT GCE twin model. MZA, monozygotic twins reared apart; MZT, monozygotic twins reared together; G, genetic factors; C, common environmental factors; E, unique environmental factors; g, c, e are path coefficients; P1, phenotype of twin 1; P2, phenotype of twin 2. Circles represent latent (unmeasured) variables. Squares represent observed (measured) variables. Single-headed arrows represent hypothesized casual relationships between variables. Double-headed arrows represent correlation or covariance between variables [20].

