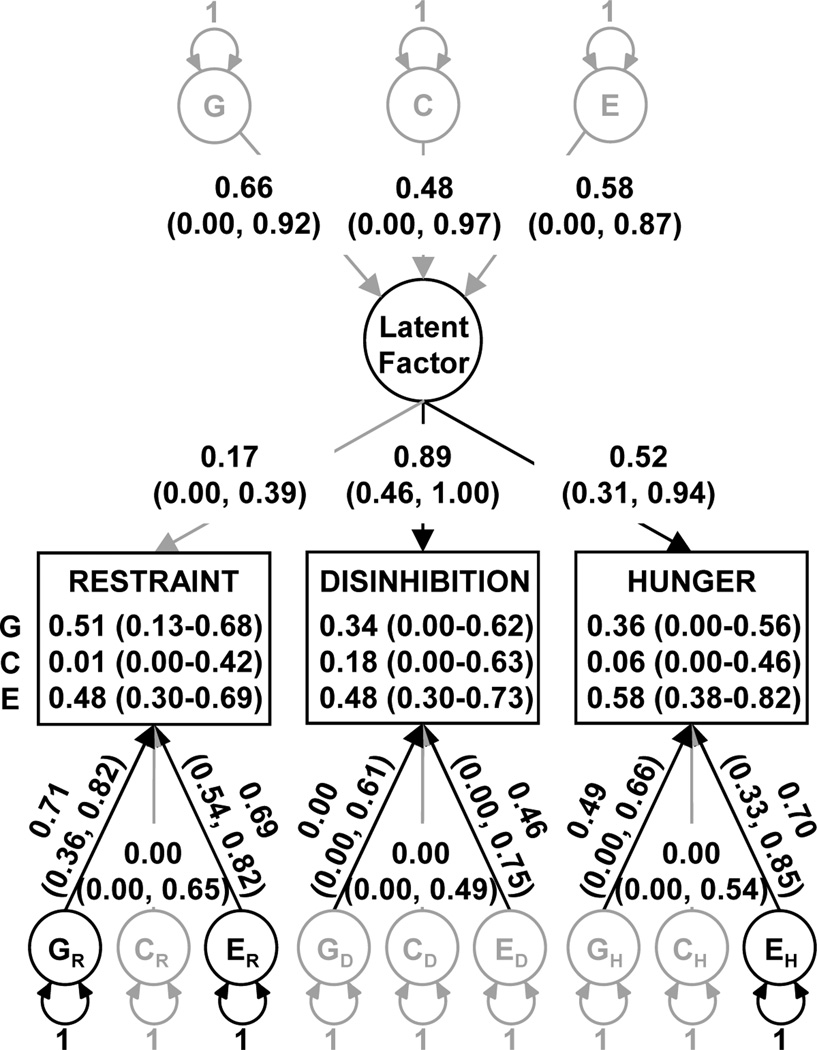
Fig. (3).
Common pathway model path diagram of Eating Inventory constructs. G, genetic; C, common environmental; E, unique environmental. Rectangles represent observed variables, and the proportion of variance due to G, C and E (with 95% CI in parentheses) is printed in each rectangle. Circles represent latent or unmeasured variables. Single-headed arrows represent hypothesized casual relationships between variables. Double-headed arrows represent variance. Path coefficients are standardized parameter estimates and 95% confidence intervals are reported in parentheses. Darkened lines indicate statistically significant paths. Subscripts indicate variable or factor under influence.

