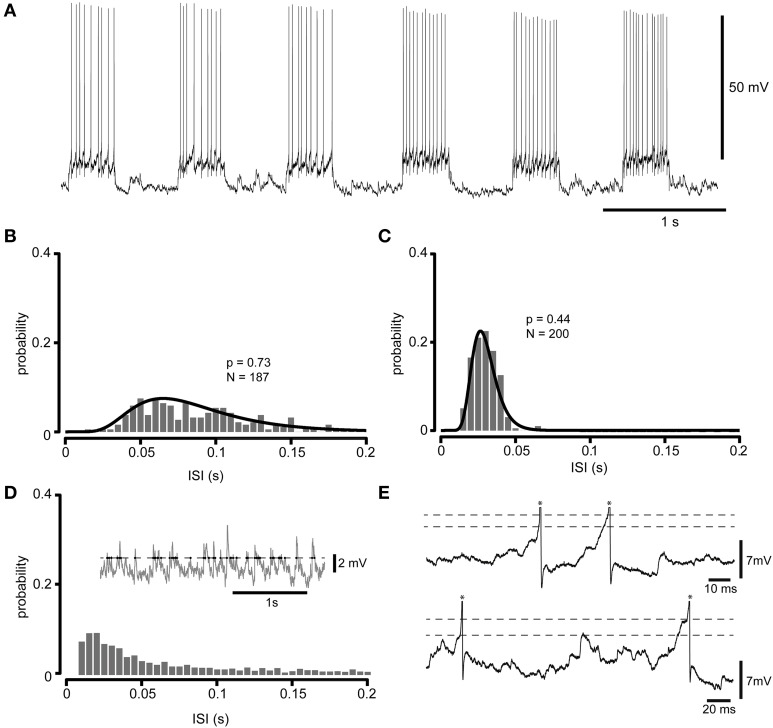
Figure 1.
Whole cell recording at multiple firing levels. (A) Raw intracellular recording illustrating the spikes of a spinal interneuron recorded at rest and with two higher firing levels obtained through current injection (200 pA and 400 pA, respectively). (B) Frequency distribution histogram (5 ms bin width) of ISIs obtained by injections of 200 pA. The ISIs of all current injections at this level was pooled to construct the histogram. Also indicated is the log-normal distribution that provided the best fit for the ISI distribution at this firing level. (C) As in (B), but for 400 pA injected current. In (B,C), the p-value is given by the AD test, and indicates whether the null hypothesis that the ISIs originate from the log-normal distributions can be rejected or not. Since they are well above any confidence limit the found lognormal distributions can be said to well describe the ISI distribution. (D) For comparison, an analysis of the crossings of an arbitrary threshold level in the spontaneous synaptic activity. Same neuron as in (A–C), but slightly hyperpolarized to prevent spiking. The inset show a raw intracellular sweep (2nd order Butterworth high-pass filter with a cutoff frequency of 1 Hz and a subsequent 2nd order Butterworth low-pass filter with a cutoff frequency of 1000 Hz; ISIs below 10 ms, which was not observed in this neuron (cf. C), were excluded for clarity) with a sample arbitrary threshold level (dashed line) and time points at which the membrane potential crossed from subthreshold to suprathreshold values (dots). The histogram illustrates the inter-event interval (IEI) distribution of such crossings. Note the much longer “tail” of membrane potential IEI distribution as compared to the ISI distributions in (B,C). (E) Actual spike generation could occur at different membrane potential levels. Two sample raw traces recorded in the same neuron as in (D), but without hyperpolarizing current injection, illustrate that the apparent spike (truncated, indicated by asterisks) thresholds (dashed lines, the threshold was defined as the point in time where the derivative of the membrane voltage exceeded a uniform threshold value) varied over time. Note the similarity with the findings of Naundorf et al. (2006) for neocortical neurons in that the spike initiation of our spinal interneurons also appeared to have a fast “kinked” onset with variable thresholds.

