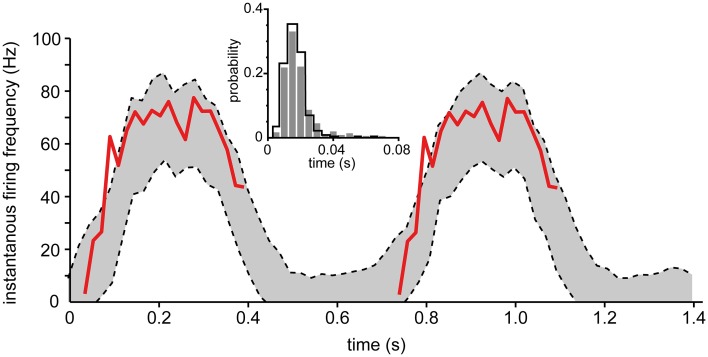
Figure 10.
Comparison of actual spike firing and spike firing predicted by the inhomogeneous model during fictive locomotion in spinal neurons. The model took the intracellular membrane potential modulation of dorsal spinocerebellar tract (DSCT) neurons (Figure 3 of Fedirchuk et al., 2013) as the driving input and predicted the spike firing or the neuron using the inhomogenous model fitted to one of our spinal interneurons. The 95% confidence bounds predicted by the model (dashed lines) is shown and compared to the actual instantaneous firing frequency (red line) (Fedirchuk et al., 2013). Just like the experimental data, the two step cycles in the figure was binned into 30 bins each, where the data to each bin was computed from 12 simulations. This procedure was repeated 250 times to calculate the confidence bounds of each bin. (inset) Histogram showing the probability distribution of the ISIs from Fedirchuk et al. (2013) (solid curve), compared to those obtained through simulation (gray bars).

