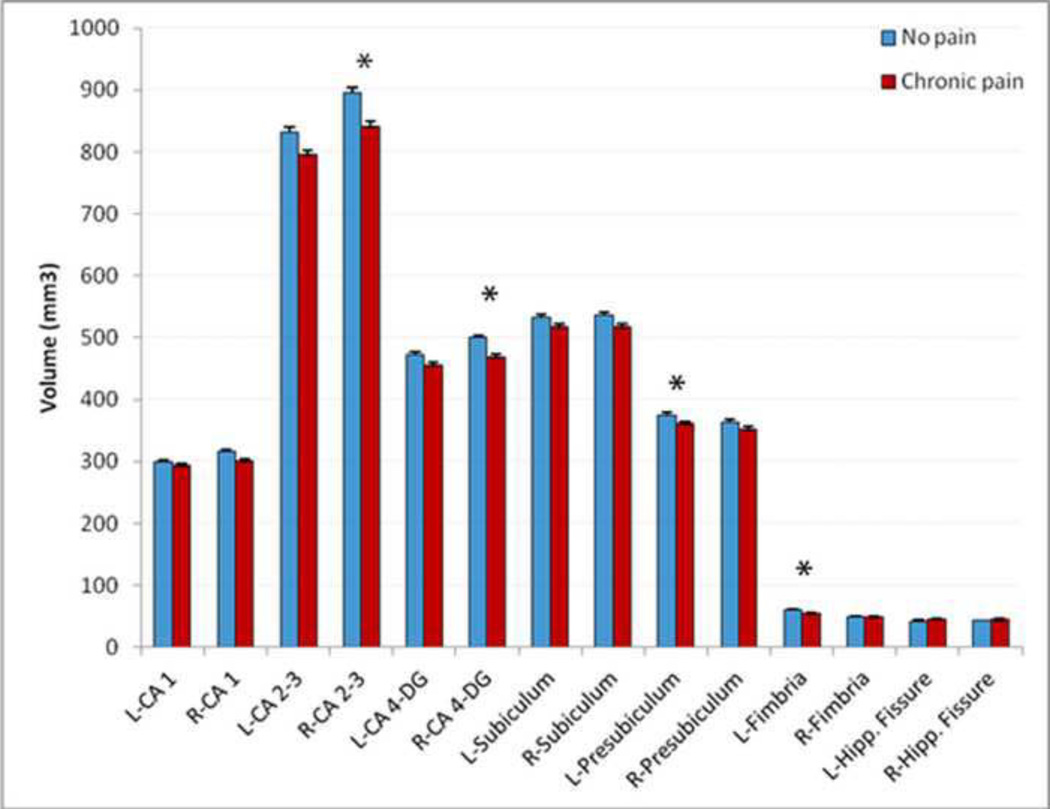
Figure 2.
Differences between groups in hippocampal subfield volumes. CA: cornus armonis; DG: dentate gyrus; Hipp: hippocampal. Bar graphs present data distribution with average means and 95% confidence interval of hippocampal subfield volumes among participants with and without chronic pain. (*) Indicates significant results. Error bars represent standard error of mean.

