
Fig. 2.
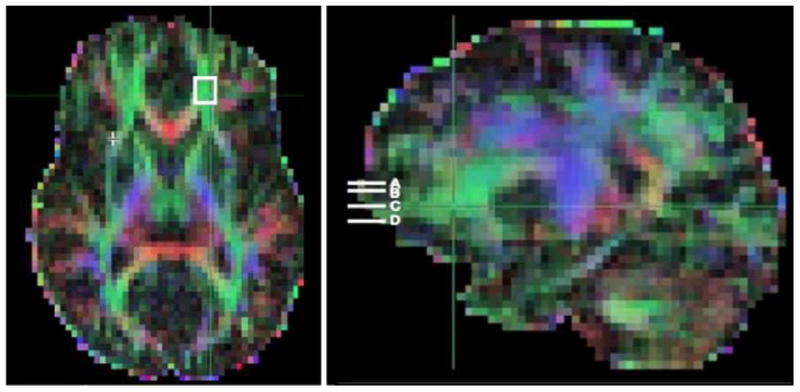
DTI FA whole-brain color map of data from a selected research participant. The image on the left shows an axial-oblique section (in the AC–PC plane). The white box in left prefrontal white matter (PFWM) indicates the boundaries of a 3-mm-deep, 9×9-mm2 slab, across which FA values were sampled and averaged in post-processing. A similar average was obtained for the right PFWM. The image on the right shows a parasagittal section of the same color map, depicting the positions of the four parallel prefrontal white-matter slabs (white bars) located at the level of the AC– PC plane (C), 6 mm below (D), and 6 (B) and 9 (A) mm above. Averages of left and right PFWM FA were obtained at each level.