
Figure 6.
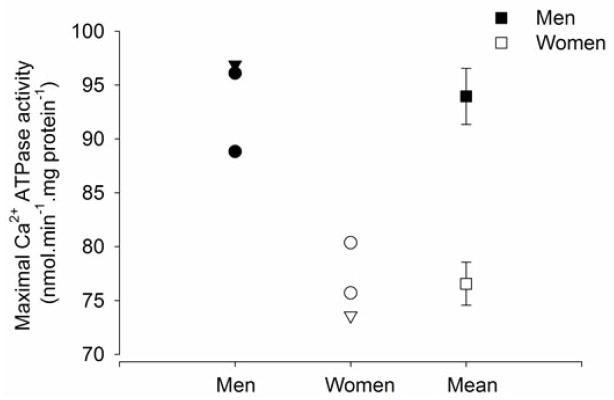
Maximal rates of sarcoplasmic reticulum Ca2+ATPase activity for whole muscle homogenates (obtained via needle biopsies of the vastus lateralis) of young men (n = 27) and women (n = 31) at rest. Men are represented in the closed symbols and women in the open symbols. Data plotted as circles, are from 4 different studies that examined men only (Booth et al., 1997, Li et al., 2002), women only (Hunter et al., 1999, Thom et al., 2001). The triangles are men and women in the same study (Harmer et al., 2014). The mean (±SEM) of the men and women from all the studies are plotted on the right side of the figure (squares) showing that men have faster maximal Ca2+ATPase activity than women.