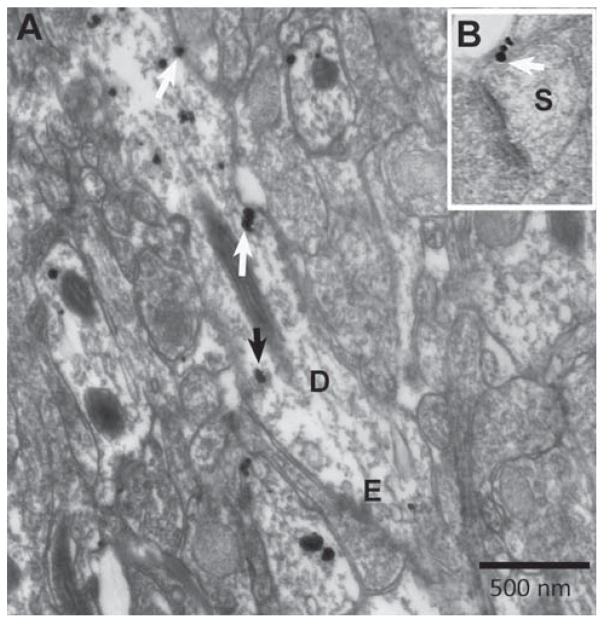
Fig. 2.
Electron micrographs show the ultrastructural location of α4 immunoreactivity in a variety of subcellular locations. Using silver-intensified gold (SIG) as the immunolabel, the subcellular location of SIG was categorized as plasmalemmal vs. intracellular, and as occurring within spine vs. shaft domains of dendrites. Panel A shows a single SIG particle (white arrow) spanning the plasma membrane of the dendritic shaft (D) with an excitatory synapse (E) and a cluster of two SIG particles on the plasma membrane of the shaft (white arrow). These three SIG particles would be included in the plasmalemmal labeling counts. The number of membranous SIGs was divided by the shaft membrane length to yield the membrane density. One example of an intracellular particle is indicated with a black arrow. The number of intracellular SIGs was divided by the intracellular area to obtain the intracellular density. Both panels were taken from an ABA animal. Panel B is an example of a spine profile (S) with a group of three SIG particles (white arrow). Calibration bar =500 nm.

