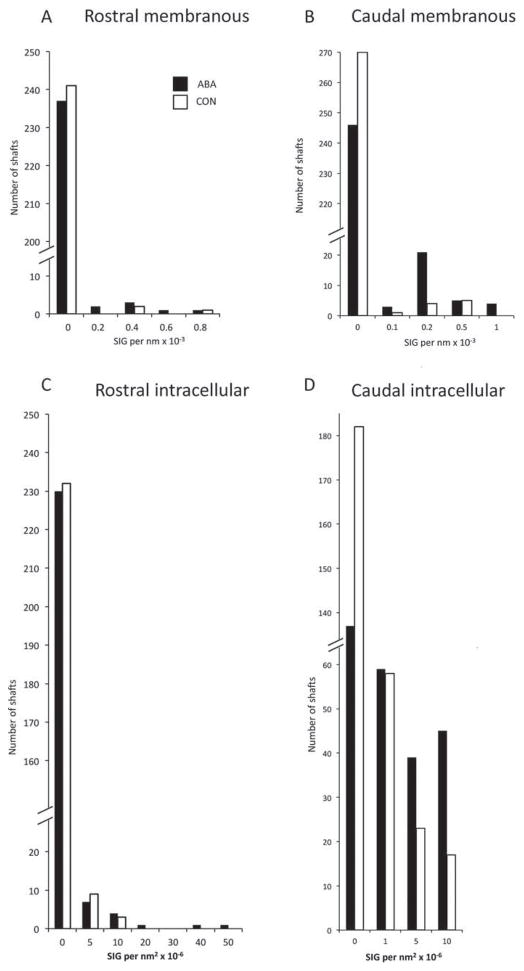
Fig. 4.
Comparisons of levels of α4-immunoreactivity of the rostral and amygdala of females following 4 days of ABA versus CON on and within postsynaptic dendritic shafts. Dendritic shafts postsynaptic to excitatory synapses were identified and their perimeter and area were measured. Panels A and B show membranous labeling from the amygdala (Panel A) and from the amygdala (Panel B). The number of SIG particles per unit membrane was quantified and plotted as a histogram of the number of dendritic profiles with different densities of SIG particles on the membrane. The ABA and CON distributions are significantly different by the Mann–Whitney U test in the amygdala (P =0.002) but not so in the rostral BA. Panels C and D show data from the cytoplasm of rostral and caudal BA, respectively. The number of SIG particles per unit area of dendritic shaft cytoplasm was quantified and plotted as a histogram. The ABA and CON distributions are significantly different by the Mann–Whitney U test in the amygdala (P <10−6) but not so in the amygdala (P =0.27). The dendrite shown in figure B is in the column labeled 0.2 SIG per nm × 10−3 in the top right panel and in the column labeled 10 SIG per nm2 × 10−6 in the bottom right panel.

