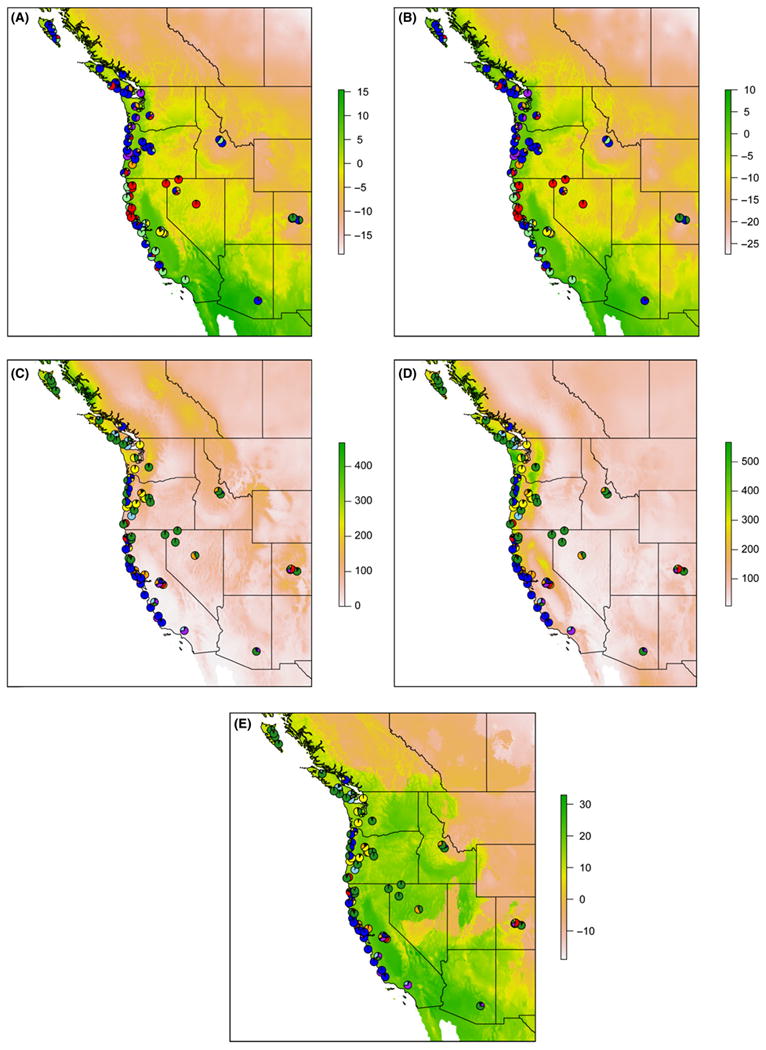
Fig. 4.

Heat maps of WorldClim variables with structure-derived clusters superimposed for 82 Mimulus guttatus accessions (one Alaska accession is excluded) for the noninverison (A, B) and inversion (C–E) markers. (A) Heat map of mean temperatures (°C) of the coldest quarter of the year with noninversion marker clusters at K = 8. (B) Heat map of minimum temperatures (°C) of the coldest month of the year with noninversion marker clusters at K = 8. (C) Heat map of precipitation levels (mm) of the driest quarter of the year with inversion marker clusters at K = 7. (D) Heat map of precipitation levels (mm) of the wettest month of the year with inversion marker clusters at K = 7. (E) Heat map of mean temperatures (°C) of the driest quarter of the year with inversion marker clusters at K = 7.
