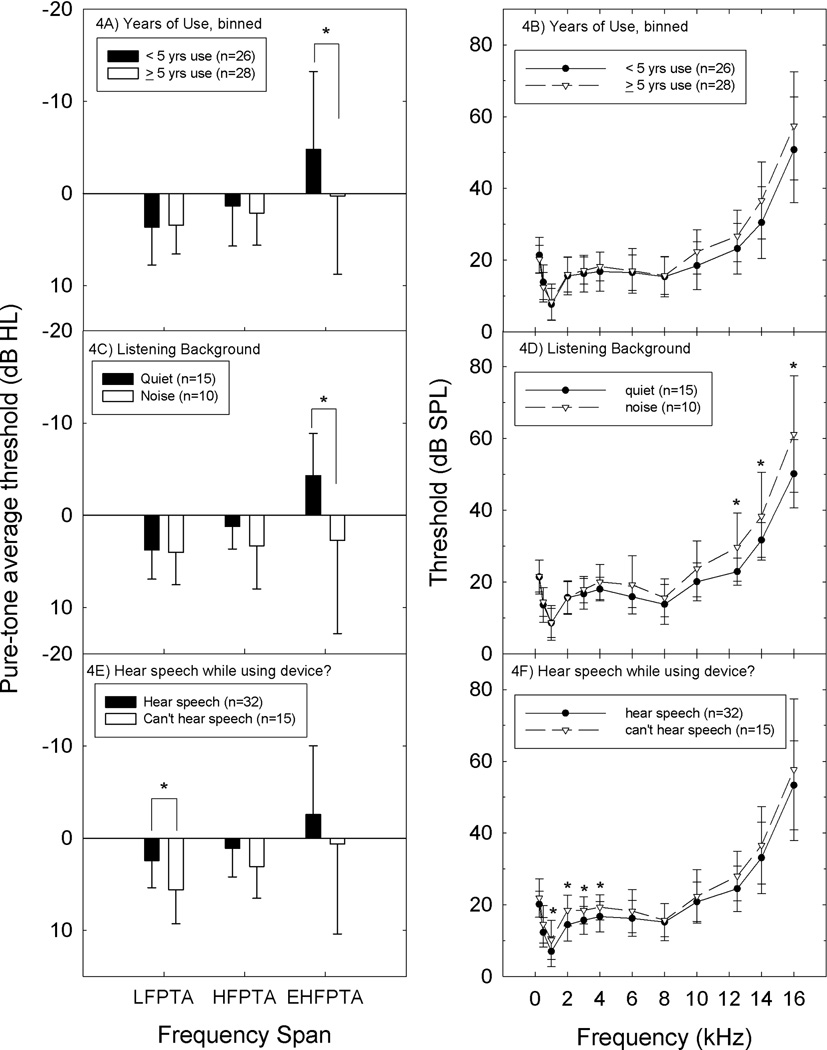
Figure 4.
A. There was a statistically reliable relationship between PTA threshold and long-term use of a music player device, defined as greater than 5-years of device use, using the EHFPTA metric (average threshold at 10, 12, 14, and 16 kHz). Figure 4B. Single frequency comparisons revealed statistically reliable differences at 10 and 14 kHz. Group differences at 12 and 16 kHz were not statistically reliable at the α=0.05 level. Figure 4C. Average PTA thresholds at EHF frequencies were reliably worse in those subjects that used their devices in noisy backgrounds (p<0.05). Figure 4D. Single frequency comparisons revealed statistically reliable differences at 12, 14, and 16 kHz. Figure 4E. Average PTA threshold for low frequencies (0.5, 1, 2 kHz) was reliably worse in those subjects that could not hear others speaking to them (p<0.05) with a similar trend observed for conventional high frequencies (3, 4, and 6 kHz: HFPTA p=0.055). Figure 4F. Single-frequency comparisons revealed statistically reliable differences at 1, 2, 3 and 4 kHz.

