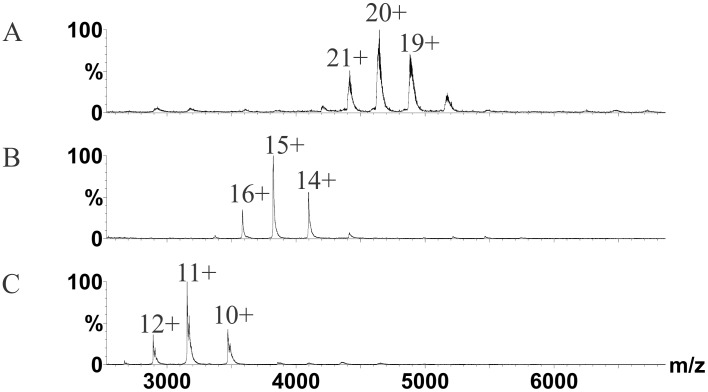
Figure 2. Complex formation of PEX3 with PEX19 monitored by nano-electrospray MS.
The spectra were recorded under conditions that preserve non-covalent interactions showing A, MS on PEX3T-PEX19 heterodimer, B, PEX3 monomer and C, PEX19 monomer. Samples were analyzed at 10 µM concentrations for the complex and five-fold higher for the monomers. No homodimers were detected in the spectra. The numbers of the respective peaks represent the charge states. Relative intensities (%) are plotted against mass-over-charge (m/z).

