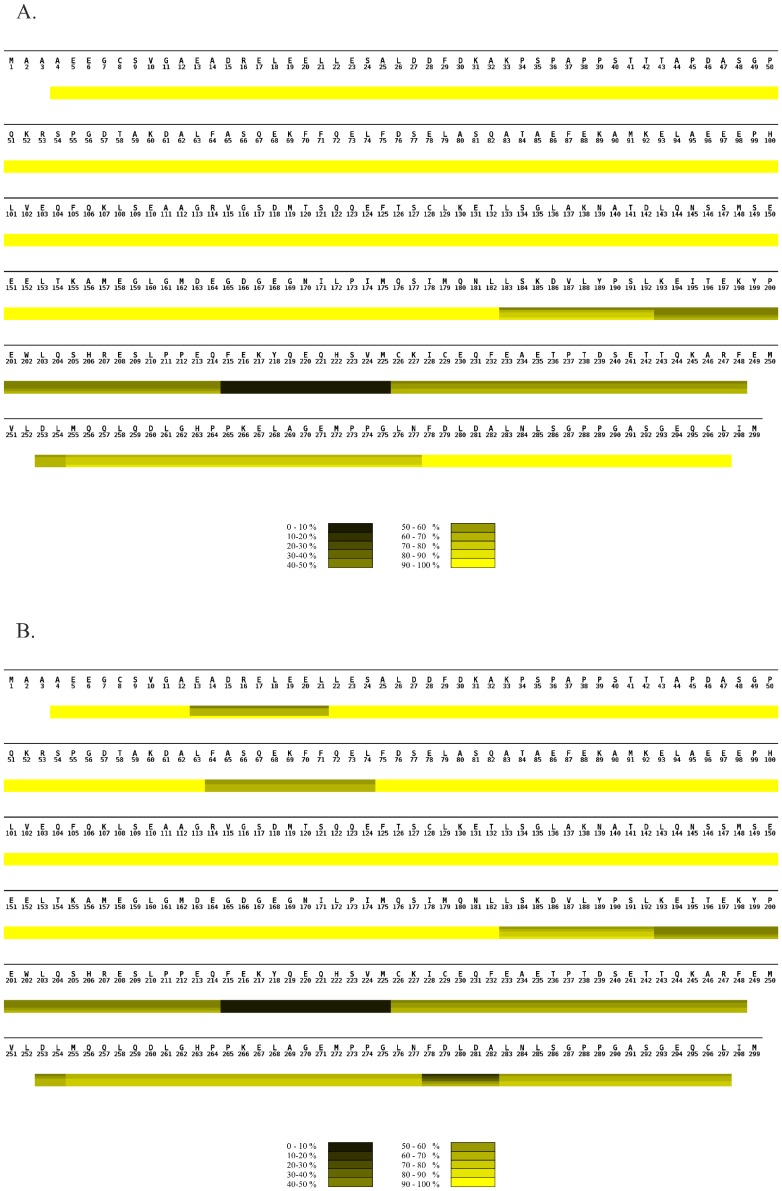
Figure 3. Comparison of hydrogen exchange in PEX19 alone and in complex with PEX3 monitored by MS.
(A) HXMS heat map of PEX19 monomer summarizing the deuterium uptake over time. (B). HXMS heat map of PEX19 in the heterodimer with PEX3 summarizing the deuterium uptake over time. (A and B). The sequence of the protein is shown above the heat map. Although the recombinant protein includes an N-terminal tag only the full sequence of human PEX19 is shown with the numbering starting at the initial PEX19 methionine. The heat maps were assembled from individual peptic peptides using MSTools [47]. The extent of the peptide is demarcated by vertical lines in each block, running through all four time point bars, when there is a difference in uptake from the preceding or following peptide. All peptic peptides are shown in Figure S1. The scale bar at the bottom of each heat map illustrates the color coding for deuterium uptake as a percentage. The horizontal bars from the top to the bottom in each block of the heat map indicate incubation times of 0, 3, 7, 40 and 60 minutes, respectively. White bars represent the residues for which no data were available.

