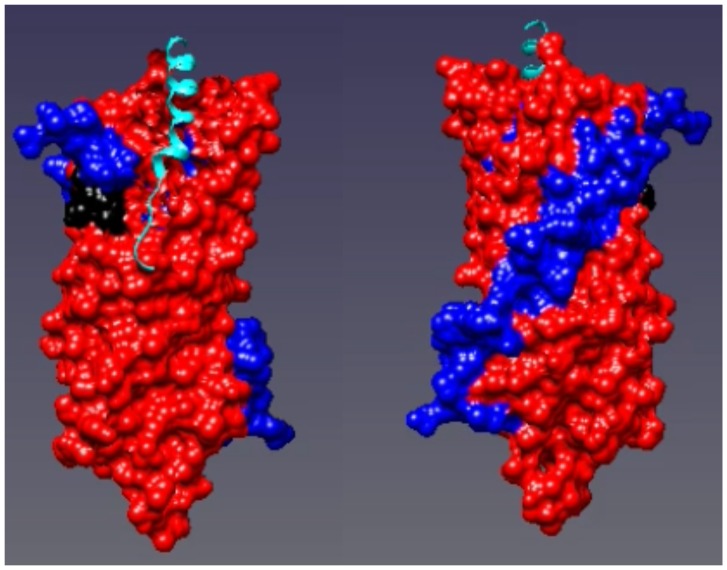
Figure 5. The heat map of PEX3 plotted on the X-ray structure of PEX3 with a PEX19 peptide bound (PDB ID: 3AJB) [40].
Regions where the hydrogen/deuterium exchange decreased in the heterodimer compared to PEX3 alone are shown in red. Regions where the exchange remained the same are shown in blue. The left hand panel is rotated 180° along the Y axis compared to the right hand panel.

