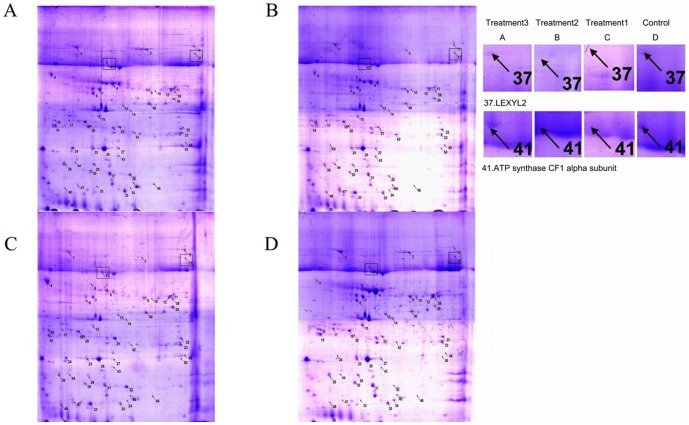
Figure 6. Two-dimensional gel electrophoresis analysis of proteins in leaves subjected to different treatments.
A: Plants treated with B. cinerea (107 cfu spores/mL) alone. B: Plants treated with C. rosea (107 cfu spores/mL) alone. C: Plants inoculated with B. cinerea (107 cfu spores/mL) before the application of C. rosea (107 cfu spores/mL). D: Water control.

