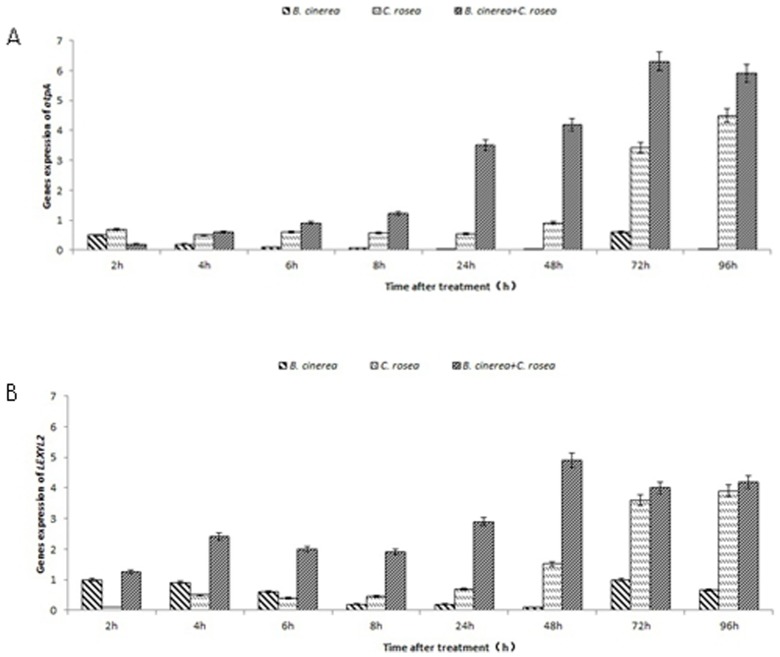
Figure 7. Expression of ATP and LEXYL2 genes in tomato leaves subjected to different treatments.
Left-diagonal hatched bars indicates plants treated with B. cinerea (107 cfu spores/mL), horizontal bars indicates plants treated with C. rosea (107 cfu spores/mL) alone, right-diagonal hatched bars indicates plants inoculated with B. cinerea (107 cfu spores/mL) before the application of C. rosea (107 cfu spores/mL). Each experiment was repeated three times. Data are presented as mean ± S.D. Means marked with different letters (a, b, c) are significantly different at P<0.05. A: Expression of ATP genes in tomato leaves. B: Expression of LEXYL2 genes in tomato leaves.

