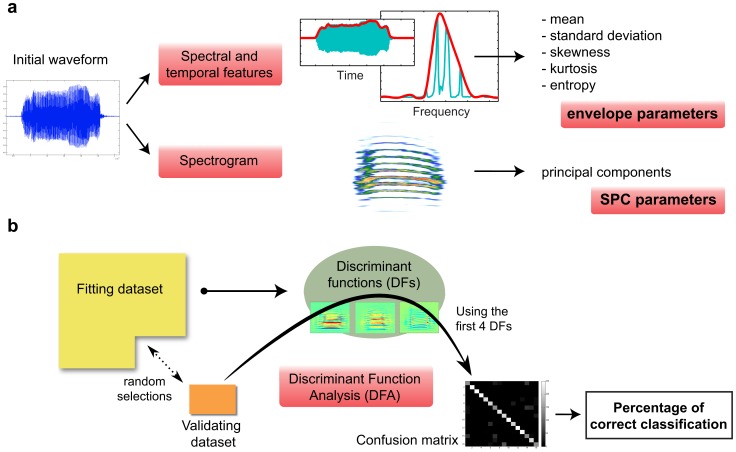
Figure 2. Overview of the acoustical analysis.
This figure summarizes the procedure for extracting both sets of parameters (a), and the subsequent discriminant function analysis (b). The discriminant functions were calculated using the fitting dataset, and we tested the validating dataset against these to obtain the percentages of correct classification.

