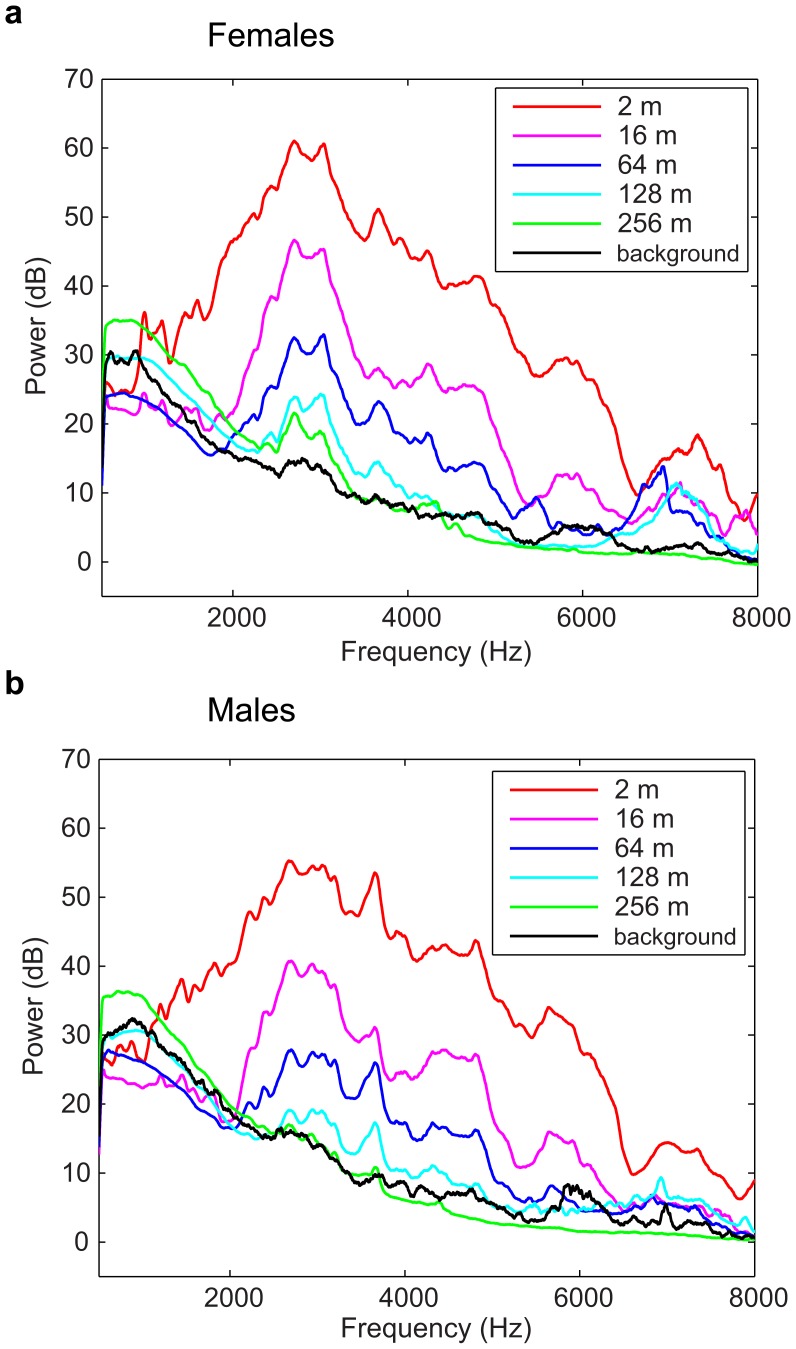
Figure 4. Frequency power spectra of calls at every propagation distance (from 2 m to 256 m).
These were calculated using all female (a) and male (b) distance calls recorded in France. The frequency spectrum of the background noise at the recording sites is shown in black. This curve was obtained by averaging the noise spectrum across all recording sites and can therefore be slightly higher than the noise floor at particular distances, as it can be observed for the lower frequency range.

