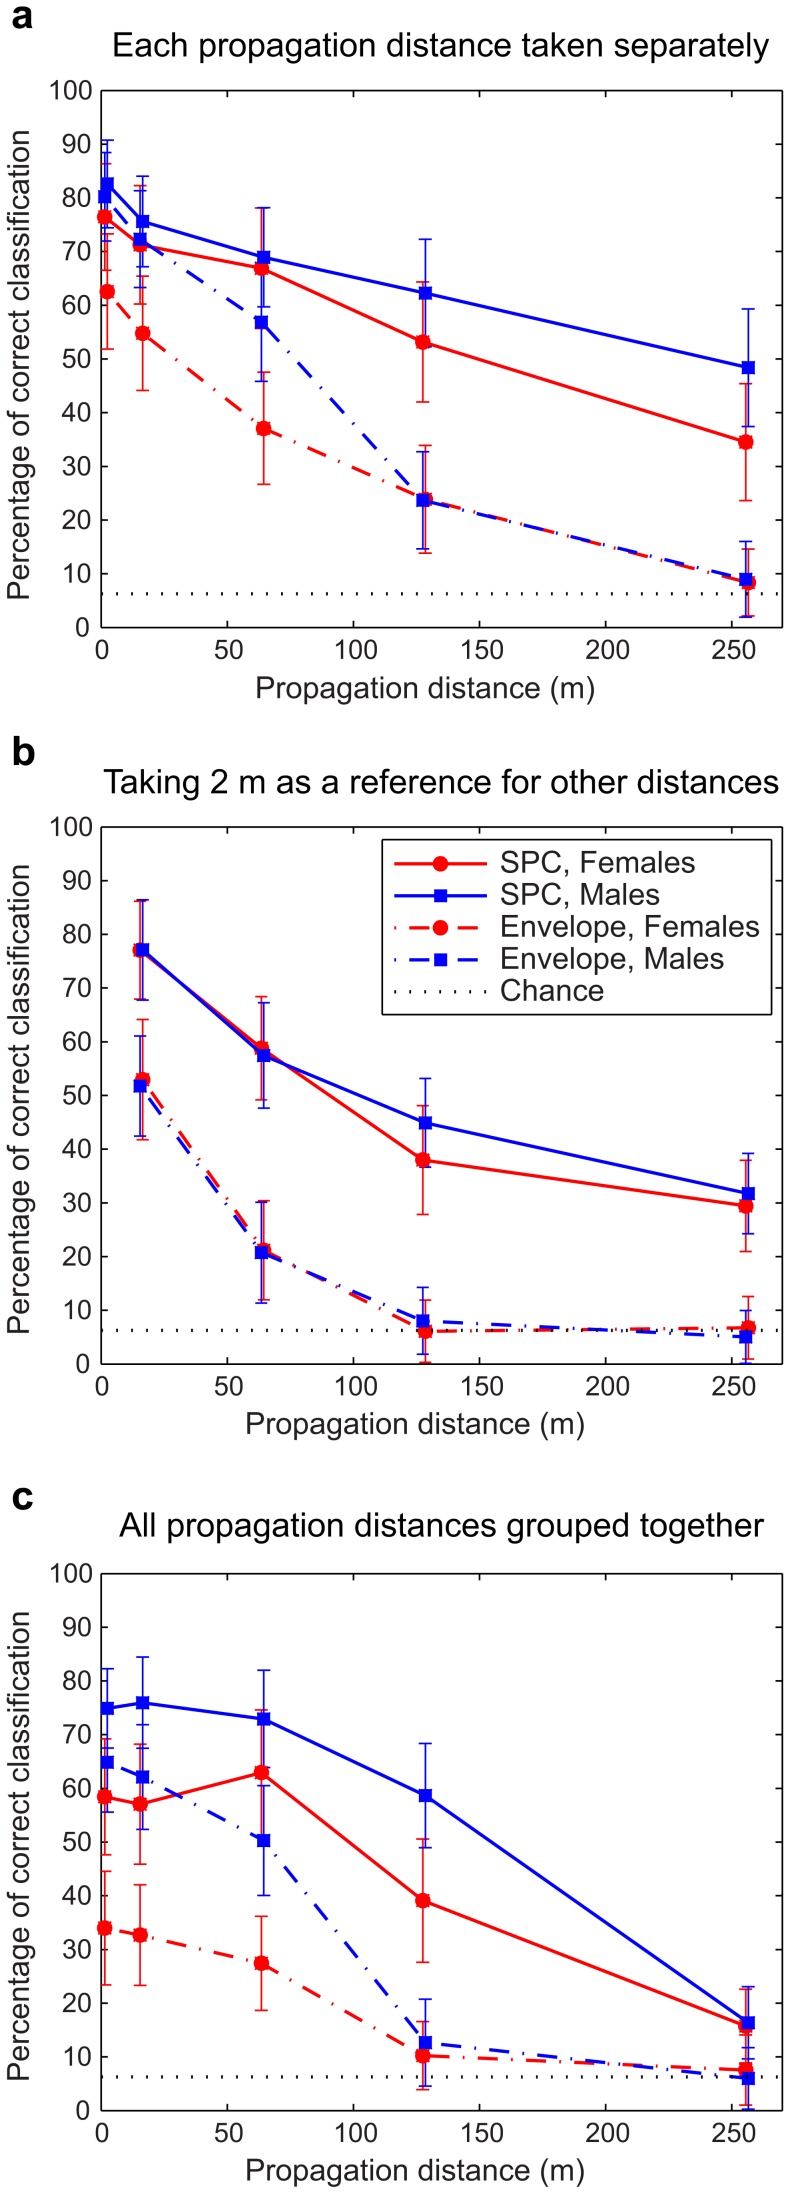
Figure 7. Mean percentages of correct classification obtained for each propagation distance and both sexes.
(a) Taking the data for each propagation distance separately, (b) taking the 2 m data as a reference for other distances, and (c) taking all propagation distances into account. SPC parameters are represented as solid lines and envelope parameters as dash-dot lines. Standard deviations are indicated. The chance level, corresponding to 6.25% of correct classification, is shown as a horizontal dotted line.

