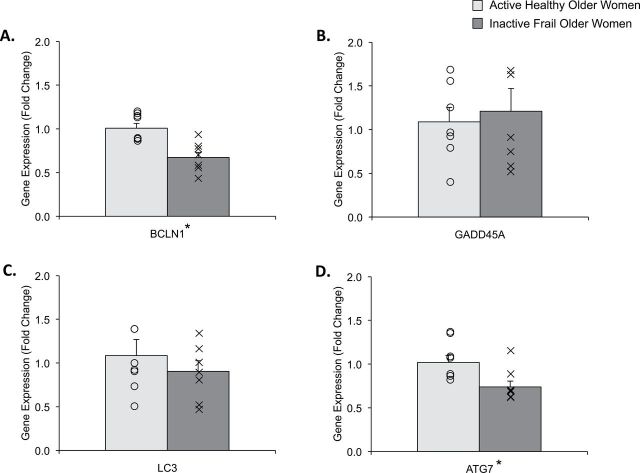
Figure 1.
Figure represents skeletal muscle gene expression data for (A) BCLN1, (B) GADD45A, (C) LC3, and (D) ATG7 in active healthy (light gray) and inactive frail (dark gray) older women. Data (mean ± SE) are reported as fold change from active healthy older women. The “O” and “X” represent individual data points for the active healthy and inactive frail older women, respectively. *Indicates significantly different from active healthy older women (p < .05).

