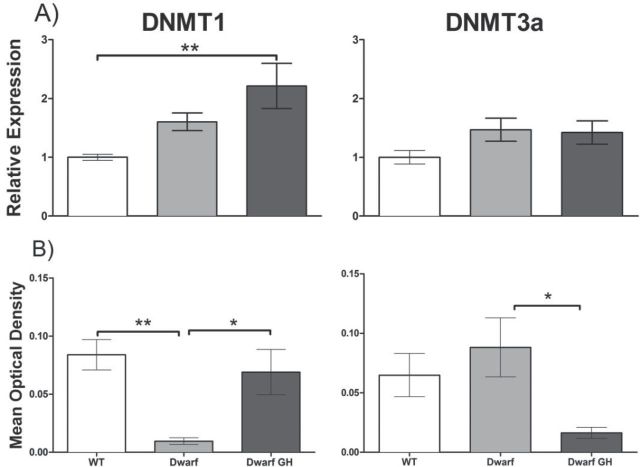
Figure 5.
DNMT mRNA and protein expression are altered by growth hormone in Ames dwarf liver. (A) Liver DNMT mRNA expression is shown for wild-type mice injected with saline (n = 10–11, open bars), dwarf mice injected with saline (n = 10–11, gray bars), and dwarf mice injected with growth hormone (n = 10, black bars) at 5–6 months of age. One-way analysis of variance for DNMT1 p = .0054 (left graph) and for DNMT3a p = .1202 (right graph). (B) Western blot analysis of whole liver lysate showing differences in overall DNMT protein expression (n = 5–8). One-way analysis of variance for DNMT1 protein p = .0021 and for DNMT3a protein p = .0367. *p < .05 and **p < .01 using Bonferroni’s Multiple Comparison test. Bars represent means ± SEM.

