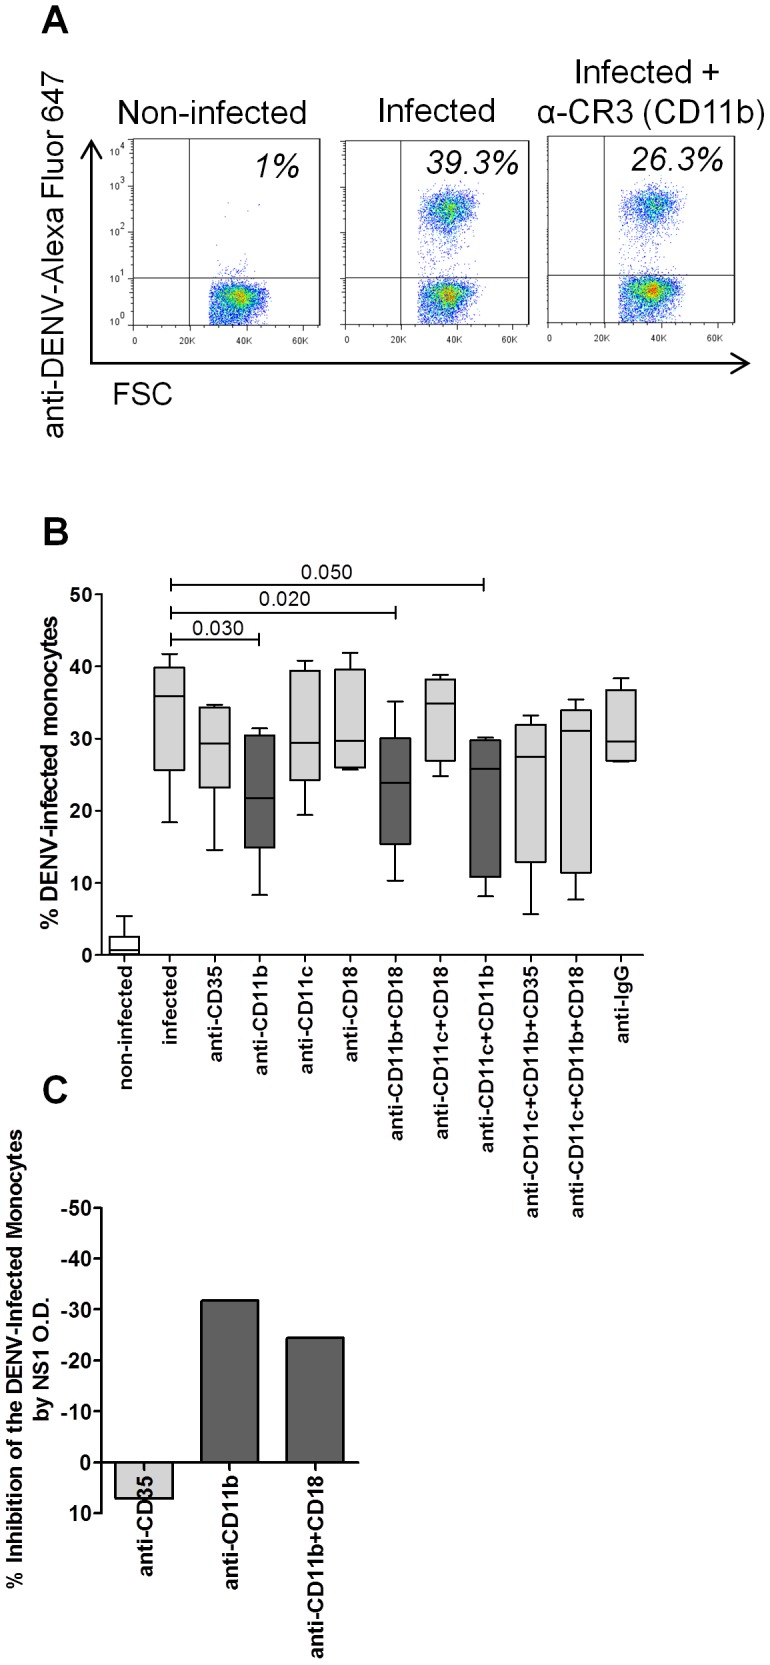
Figure 2. Effect of CR blocking antibody on the maturation of monocytes infected in vitro with DENV-2.

Flow cytometry was performed to determine the frequency of anti-DENV complex staining on monocytes. In parallel, DENV NS1 antigen was made in the supernatant of these cultures of monocytes by ELISA. Both methods were used when monocytes were pre-treated or not with 10 µg/ml of blocking mAbs against CR1 (CD35), CR3 (CD11b), CR4 (CD11c), CD18 or IgG, alone or combined, followed by DENV-2 infection. (A) Specific gating strategies were used to select the monocyte population as Figure 1. The percentage of anti-DENV complex monocytes was determined using quadrant statistics applied on forward scatter (FSC) versus FL-8/anti-DENV complex/Alexa-Fluor647 dot-plot distributions. Representative dot plots are shown for non-infected and DENV-2-infected monocytes with or without CR3 (CD11b) blocking. (B) Box represents independent experiments in nine different subjects. Vertical bars indicate the median and interquartile range for each condition. (C) The mean percentage of DENV infection inhibition was determined by the reduction of the viral protein NS1 amounts on supernatants by the following formula: O.D. viral protein NS1 amounts condition test ×100/O.D. viral protein NS1 in DENV-2-infected monocytes reduced of the 100, utilising samples collected from 8 different subjects. OD, optical density. The Mann-Whitney U-test was used in order to analyse differences among different conditions. Statistically significant p-values for differences between patients and controls are shown above the pairs.
