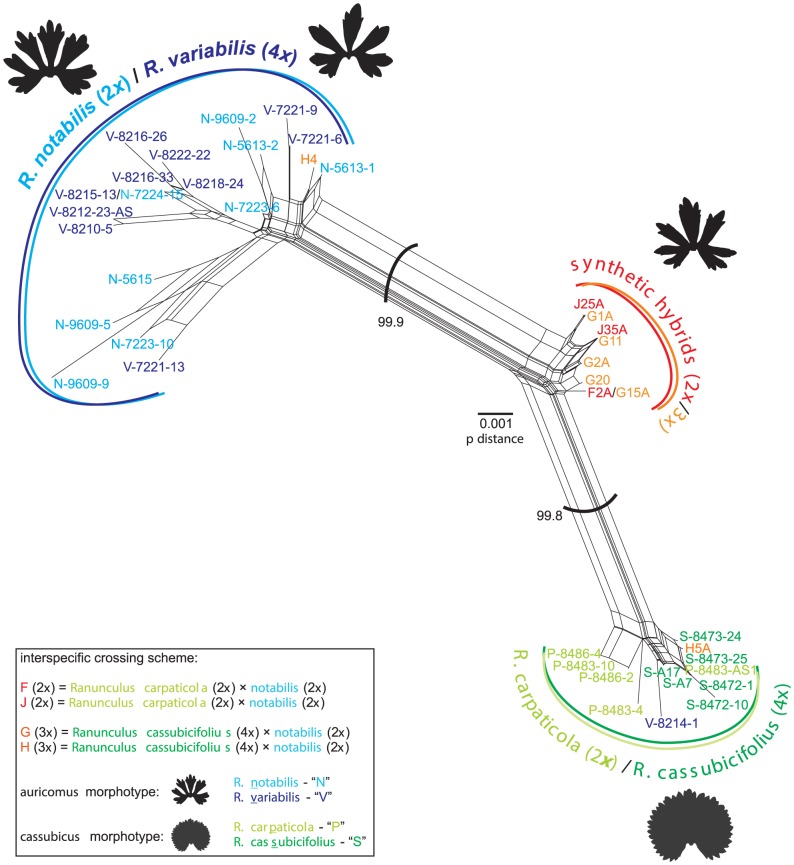
Figure 2. NeighborNet analysis of interspecific ITS1+ITS2 variability within the Ranunculus auricomus complex.
NeighborNet analysis of all ITS1+ITS2 sequences obtained by direct sequencing of the studied individuals. The spring leaf silhouettes illustrate the main phenotypic differences between the two morphotypes: the auricomus-morphotype (characteristic for R. notabilis, R. variabilis and the synthetic hybrid R. cassubicifolius × notabilis) and the cassubicus–morphotype (i.e., R. carpaticola and R. cassubicifolius). Individuals belonging to R. carpaticola are marked as “P”, R. cassubicifolius as “S”, R. notabilis as “N” and R. variabilis as “V”, respectively. Identical sequences representing the same ribotype are listed in Figure 3. Bootstrap values are given for the main clusters.

