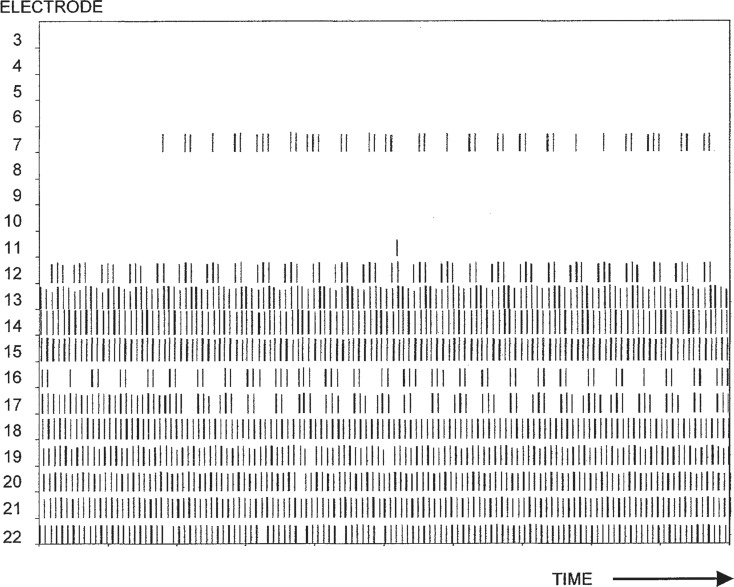
Figure 11.
Output of the ACE sound-processing scheme for an input signal consisting of the vowel /a/ sung by a woman with a fundamental frequency of 262 Hz, as in Figures 9 and 10. The abscissa shows time (total duration of 100 ms), whereas the ordinate shows each of the 20 electrodes activated by the ACE processor. The ACE scheme was programmed to select 10 spectral maxima in each stimulation period. Apical electrodes (activated by low-frequency signals) are at the bottom of the axis, while basal electrodes are at the top. The stimulation delivered by each electrode is shown as a series of short vertical bars. Each bar represents one current pulse, with the height of the bar indicating the relative current level; the range is delimited by the “T-level” and “C-level” for each electrode.

