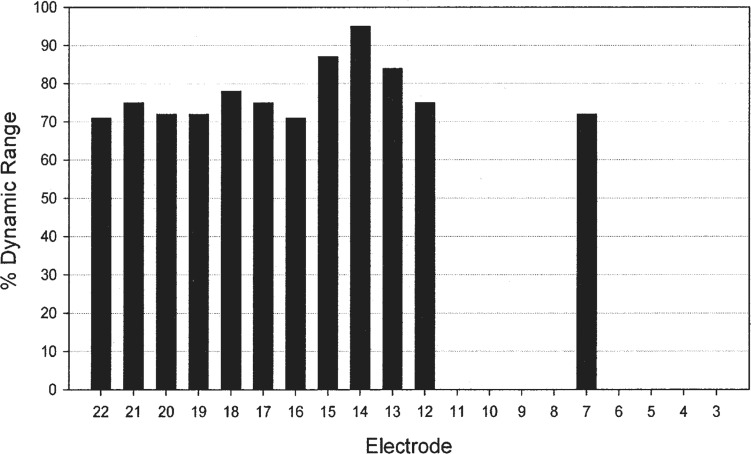
Figure 13.
The distribution of average current levels across electrodes when the vowel /a/ with a fundamental frequency 262 Hz is processed by the ACE scheme. The data plotted were derived from the graph of Figure 11. The ordinate shows the average level as a percentage of the electrical dynamic range on each electrode. The abscissa shows the 20 electrode positions activated by the ACE processor, ranging from apical on the left to basal on the right.

