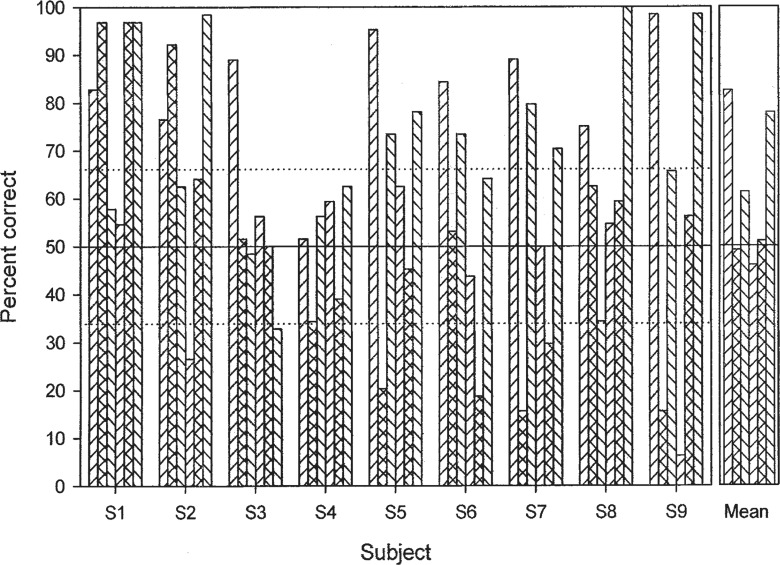
Figure 15.
Results of an experiment in which nine users of the SPEAK sound-processing scheme were asked to rank the pitch of pairs of sequential sounds having various fundamental frequencies. The sounds were the sung vowels /a/ and /i/. The fundamental frequency ratio between the two sounds in each pair was one-half of one octave. The ordinate shows percentage of correct scores for each of the subjects (abscissa), with the mean across all subjects plotted at the far right. The experimental procedure was a two-alternative forced-choice task, with a score of 50% expected for random responses; this is shown as the solid horizontal line. The two dotted horizontal lines delimit the values required for the scores to be significantly different from chance (p < .01). Note that scores below the lower dotted line indicate pitch reversals. For each subject, and for the mean across subjects, the data are plotted as clusters of six columns. In each cluster, the three columns on the left represent data for the male singer; the pairs of fundamental frequencies were 98–139, 139–196, and 196–277 Hz, respectively. The three remaining columns represent data for the female singer, with fundamental frequency pairs of 262–370, 370–523, and 523–740 Hz, respectively.

