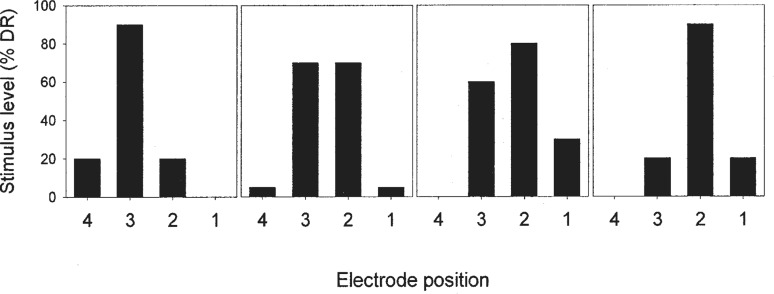
Figure 16.
Illustration of how the stimulus level distribution across nearby electrodes varies when the frequency of a pure tone input to a sound processor is increased. A typical multiple-channel sound-processing scheme such as ACE, CIS, or SPEAK is assumed. In each panel, the abscissa shows electrode positions, with apical electrodes to the left and basal electrodes to the right. Average stimulus levels are shown as a percentage of electrical dynamic range on the ordinate. In the leftmost panel, the input tone has a frequency equal to the center frequency of the bandpass filter assigned to electrode 3. The three panels to the right show the effect of increasing the tone's frequency. The rightmost panel shows the stimulus level distribution when the frequency of the tone is equal to the center frequency of the filter assigned to electrode 2.

