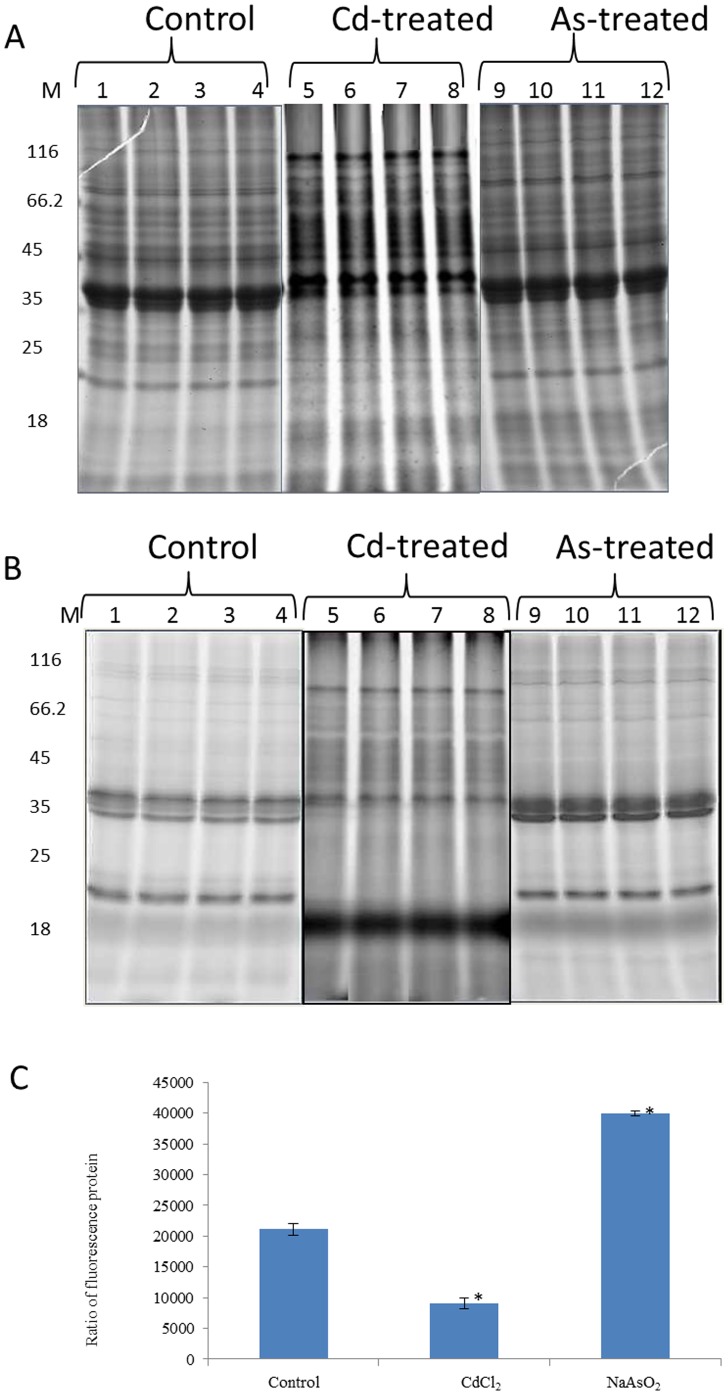
Figure 4. 1DE analysis of IAF-labelled T. asahii proteins.
Proteins (150 µg) extracted from T. asahii were labelled with 0.2 mM IAF and subjected to 1DE. The gels were scanned for IAF fluorescence in a Typhoon scanner followed by staining in colloidal coomassie. Panel A shows coomassie-stained gels whilst panel B is the corresponding IAF fluorescence image. Changes in total spot intensity between treated and untreated cells were quantified by Image Quant software analysis (Panel C).

